This article continues a series of articles on Venkman that began with Venkman Introduction.
One of the basic tasks of debugging any language is setting breakpoints. Breakpoints are places in code where execution is suspended. When you set a breakpoint in a debugging application such as Venkman, you can take advantage of the suspension to examine variables, objects, and other featues of the execution.
This article describes breakpoints in JavaScript and how to use Venkman to set and examine breakpoints.
Basic Breakpoints
The Stop button and debugger keyword are useful features of the JavaScript debugger, but when you are debugging deep in code—especially code you have authored yourself and are responsible for troubleshooting—you're going to need breakpoints.
Types of Breakpoints
Venkman has two types of breakpoints. The first, and most common, is called the "hard" breakpoint. A hard breakpoint represents an actual trap instruction included in the pseudocode of a compiled function. Hard breakpoints can only exist in the context of a function currently "live" in the browser. Hard breakpoints are the ones that actually stop program execution.
The second type of breakpoint, the "future" breakpoint, represents a promise from Venkman to set a hard breakpoint as soon as it is possible. Future breakpoints are used when you want to stop in a script that has not yet been compiled. The most common use of future breakpoints is to stop in a "top level" script (script that executes outside of any function), or script that executes during the onLoad event of a page. When a script is loaded that matches the URL of a future breakpoint, and has executable code at the specified line, Venkman will automatically set a future breakpoint.
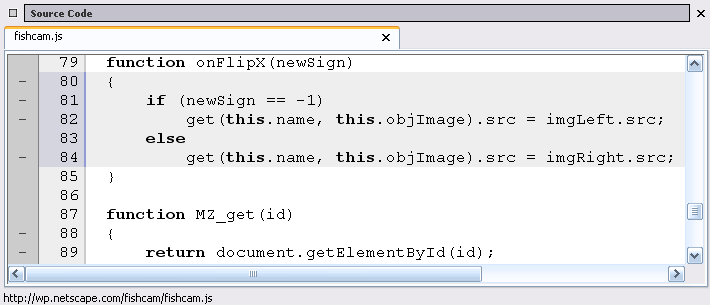
Except for this distinction, breakpoints in Venkman work like breakpoints in most other debuggers. The dots you see in the left margin of the Source Code View indicate which lines contain executable code, places where a hard breakpoint can be set.
Setting Breakpoints
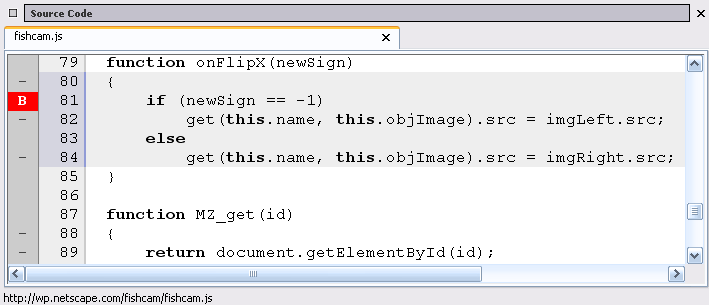
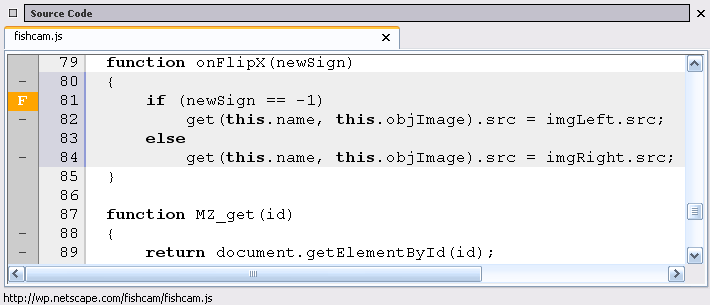
Clicking on one of these dots in the Source Code View will set a breapoint at that line. Venkman will stop BEFORE the line executes. When a breakpoint is set, the margin will change to the letter "B", as in Figure 2. If you execute this code again after having set this breakpoint, Venkman will stop at line 81. (Note: By default, Venkman hides files file that appear to be part of the browser core; this includes extensions. To debug an extension, uncheck "Exclude Browser Files" on the Debug menu and your installed extension files should appear in the Loaded Scripts list.)
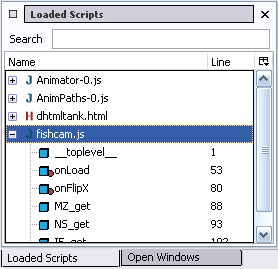
Venkman also indicates that one or more breakpoints have been set in the Loaded Scripts View, where red dots appear next to the files in which breakpoints have been set, along with the line number where the function begins whose code is being stopped.
Using Breakpoints to Debug
When you set a breakpoint, you give Venkman (or whatever debugger you're using) the opportunity to display information about the execution environment. One of the most important aspects of debugging a script or software program is the ability to examine variables—function return values, errors, counters, variable scopes—as they change over the course of the script execution.
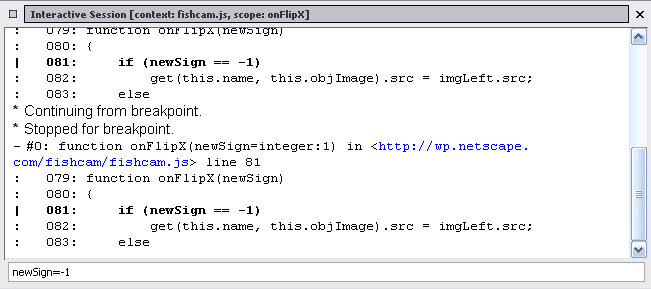
The onFlipX function in Figure 1, for example, uses the variable newSign to figure out what image to use for the fish. When you set a breakpoint at line 81, you can start animation on the web page in the browser window and see Venkman stop execution as it enters the onFlipX function. Stopped there, Venkman displays the value of the newSign variable as "1" in the Local Variables View.
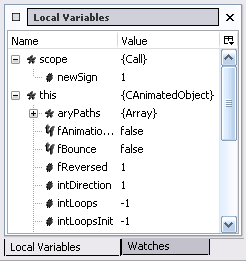
Using breakpoints and the Interactive View, you can change the values of the variables that Venkman displays (only in the context of the debugging environment itself) and see how these changes affect the execution of the code.
For more information about the sorts of actions you can take in Venkman when you're at a breakpoint, see the Debugging Basics section of the introductory Venkman article.
Clearing Breakpoints
To clear the breakpoint, click on the margin twice. The first click will clear the hard breakpoint and leave you with only a future breakpoint, which is represented by a yellow letter "F". A second click will remove the future breakpoint as well.
Advanced Breakpoints
Venkman allows you to associate a breakpoint with a script that will be executed in the scope of the function when that breakpoint is hit. This advanced feature and other options you can see for the associated script are available from the Future Breakpoint Properties dialog, which you can access by right-clicking a breakpoint and selecting Properties.
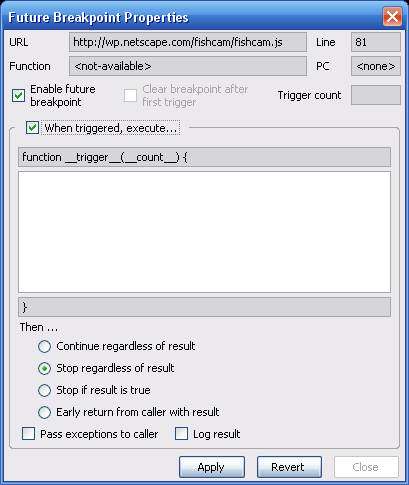
Once you've created a script that will be executed when the associated breakpoint is hit, you can select a number of different options from the Future Breakpoint Properties dialog that determine how Venkman will deal with the output of the associated script. The following options are available:
- Continue regardless of result causes Venkman to continue normal execution after running the breakpoint script. This can be useful to try out additional code, on the fly.
- Stop regardless of result causes Venkman to stop execution after executing the breakpoint script, allowing you to inspect program state.
- Stop if result is true effectively makes this a conditional breakpoint. If the breakpoint script returns a true value (it doesn't have to strictly be a boolean
true, any non-null, non-empty string, non-zero, non-undefined, and non-falsevalue will do), execution will continue normally. If, on the other hand, the script returns a false value, Venkman will stop execution at that point. - Early return from caller with result will cause the function that the breakpoint is set in to return the value of the breakpoint script as its result, immediatley after the breakpoint script completes.
- The Pass exceptions to caller checkbox allows you to pass exceptions thrown by the breakpoint script directly to the caller. Normally, if the breakpoint script generates an exception, Venkman assumes you made a mistake and stops execution after displaying the exception. If you would like to see what your code does when exceptions are thrown at it, check "Pass exceptions to caller", and thrown an exception from the breakpoint script.
- The Log result checkbox tells Venkman you want the result of the script to show up in the Interactive Session View. When used with the Continue regardless of result option, the breakpoint can be used as a simple log message.
- The number of times the breakpoint has been hit is passed in as a parameter to the breakpoint script. To reset the count, enter a 0 in the "Trigger count" field.
Meta Comments
You can also embed scripted breakpoints directly into the source code you are debugging by using a Venkman facility called meta comments. Meta comments are specially formatted comments that pull in the script named after the comment and specify how to treat the output of that script. The following meta comment types are available:
- The
//@JSD_LOGcomment will insert a breakpoint which is set to execute the script that follows without stopping. The result of the evaluation will be logged to the Interactive Session. - The
//@JSD_BREAKcomment will insert a breakpoint which is set to execute the script that follows and stop if the result is true. - The
//@JSD_EVALcommand will insert a breakpoint which is set to execute the script that follows without stopping and without logging the result. - These meta comments can be used to insert debug-only code in your scripts with zero impact on production code.
To enable meta comments in a script, select "Scan for Meta Comments" from the context menu of the file in the Loaded Scripts view.
When you add a meta comment, a normal breakpoint is created. You can change or delete this breakpoint just as you would a breakpoint created by hand.
Resources
- Venkman Introduction—previous article on Venkman.
- Venkman's home page on Devmo.
Original Document Information
- Authors: Robert Ginda, Ian Oeschger
- Published 02 May 2003