| Oracle® Airlines Data Model Reference 11g Release 2 (11.2) Part Number E26208-02 |
|
|
PDF · Mobi · ePub |
| Oracle® Airlines Data Model Reference 11g Release 2 (11.2) Part Number E26208-02 |
|
|
PDF · Mobi · ePub |
This chapter provides Oracle Airlines Data Model sample reports and includes the following sections:
Note:
The reports and dashboards shown in the examples in this chapter and delivered with Oracle Airlines Data Model are provided only for demonstration purposes. These sample reports and dashboards are not supported by Oracle.The Agent Performance Analysis reports include the following areas:
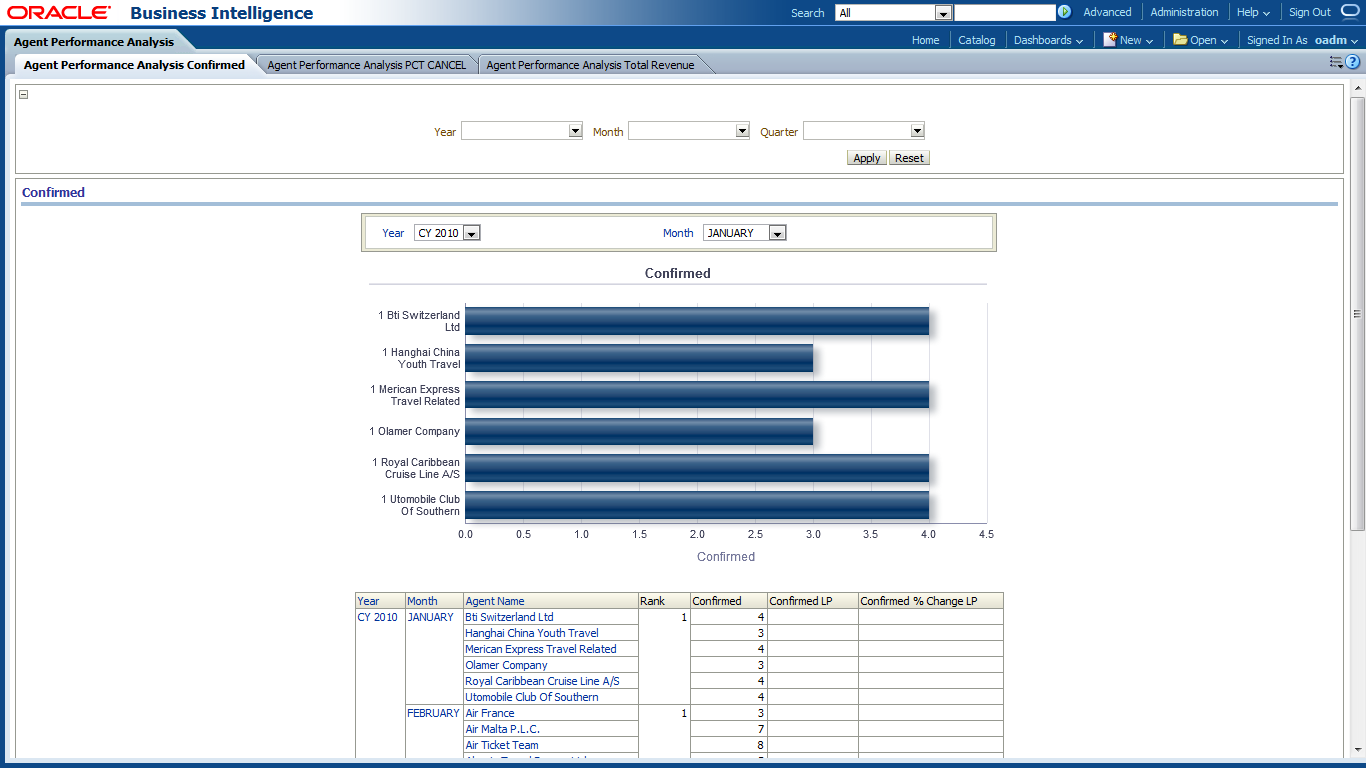
This report, as shown in Figure 11-1 provides the current year month-level agent performance analysis confirmed for each agent along with their rank. The report also shows the metrics such as Confirmed LP, Confirmed % Change LP of sales revenue.
Report dimensions are:
Time
Figure 11-1 Agent Performance Analysis Confirmed Sample Report
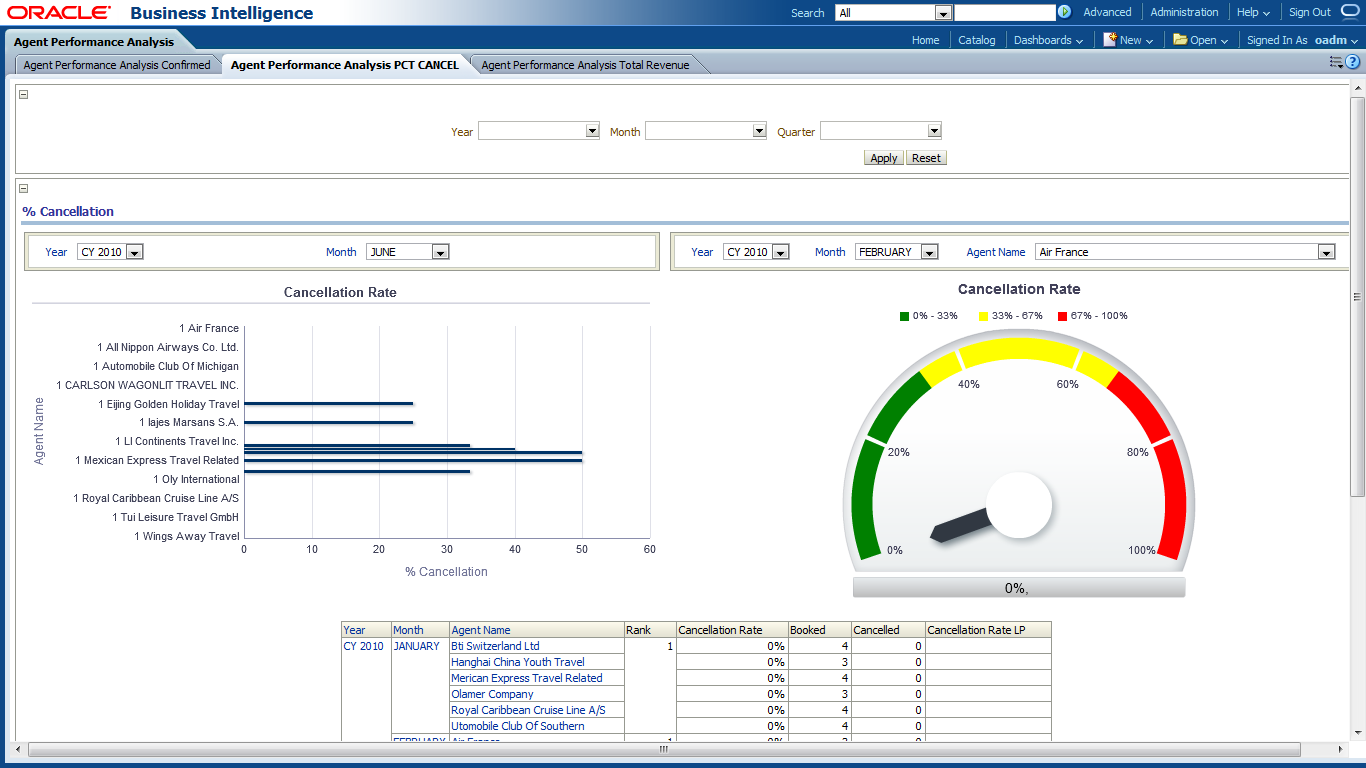
This report, as shown in Figure 11-2 provides the cancellation rate out of total bookings at month level for agents, along with their ranks. The report includes metrics such as LP for the cancellation rate.
Report dimensions are:
Time
Figure 11-2 Agent Performance Analysis PCT CANCEL Sample Report
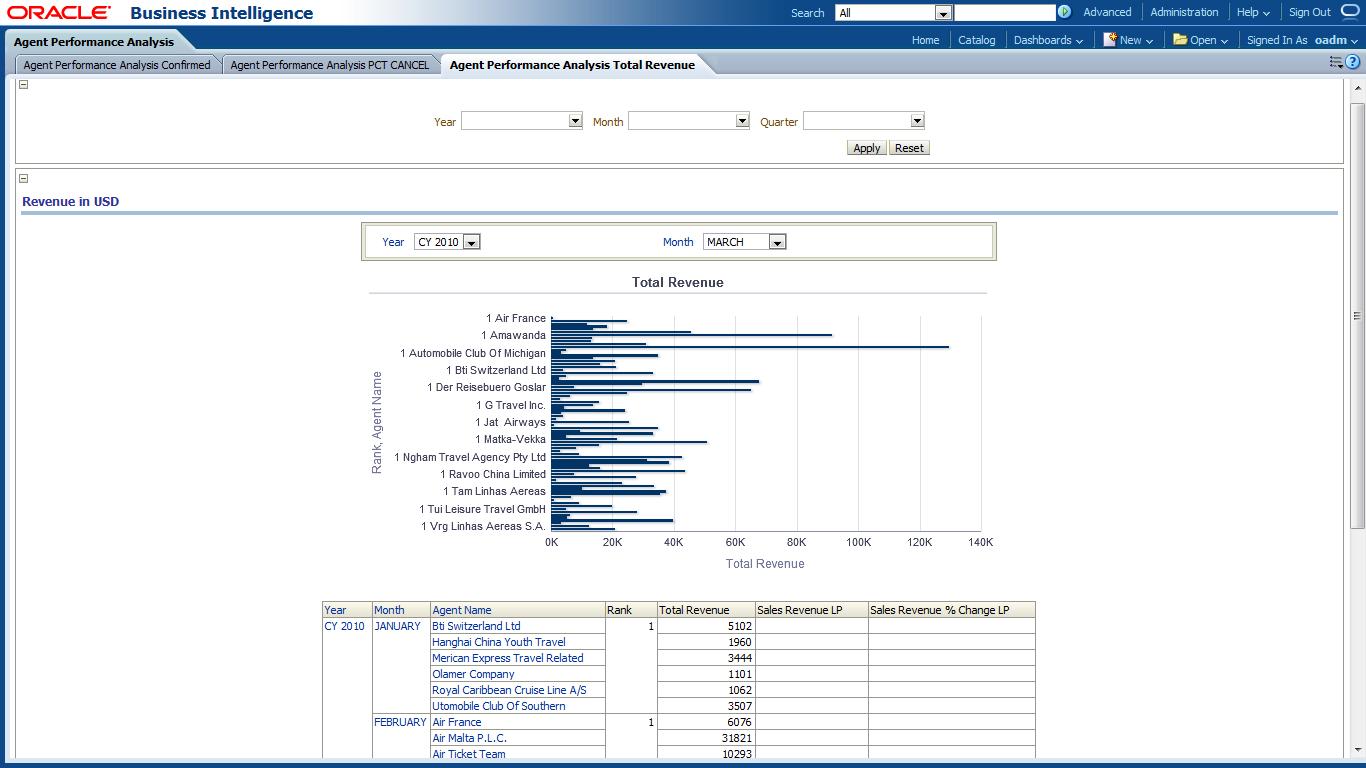
This report, as shown in Figure 11-3, provides the current year month-level total revenue basing on agent performance for each agent. The report shows the ranks of agents according to their revenue. The report also shows the metrics such as LP and % Change LP of sales revenue.
Report dimensions are:
Time
Figure 11-3 Agent Performance Analysis Total Revenue Sample Report
The Booking Analysis reports include the following areas:
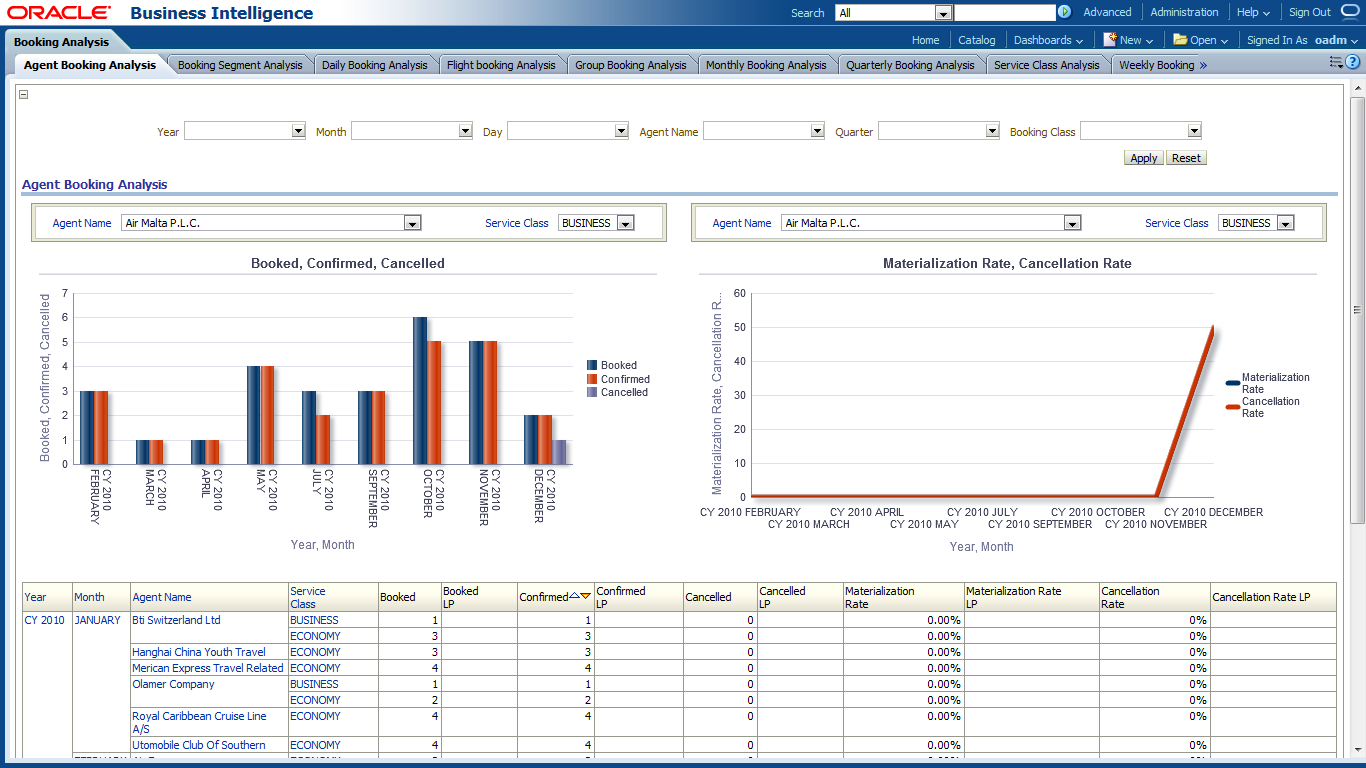
This report, as shown in Figure 11-4 provides the year wise month level agent booking analysis. The report provides information on the number of booked tickets, confirmed tickets, and canceled tickets out of the booked and what is the materialization rate, along with the metrics LP, % Change LP for booked, canceled, confirmed, and the materialization rate and cancellation rate.
Report dimensions are:
Time
Agent Name
Booking Class
Figure 11-4 Agent Booking Analysis Sample Reports
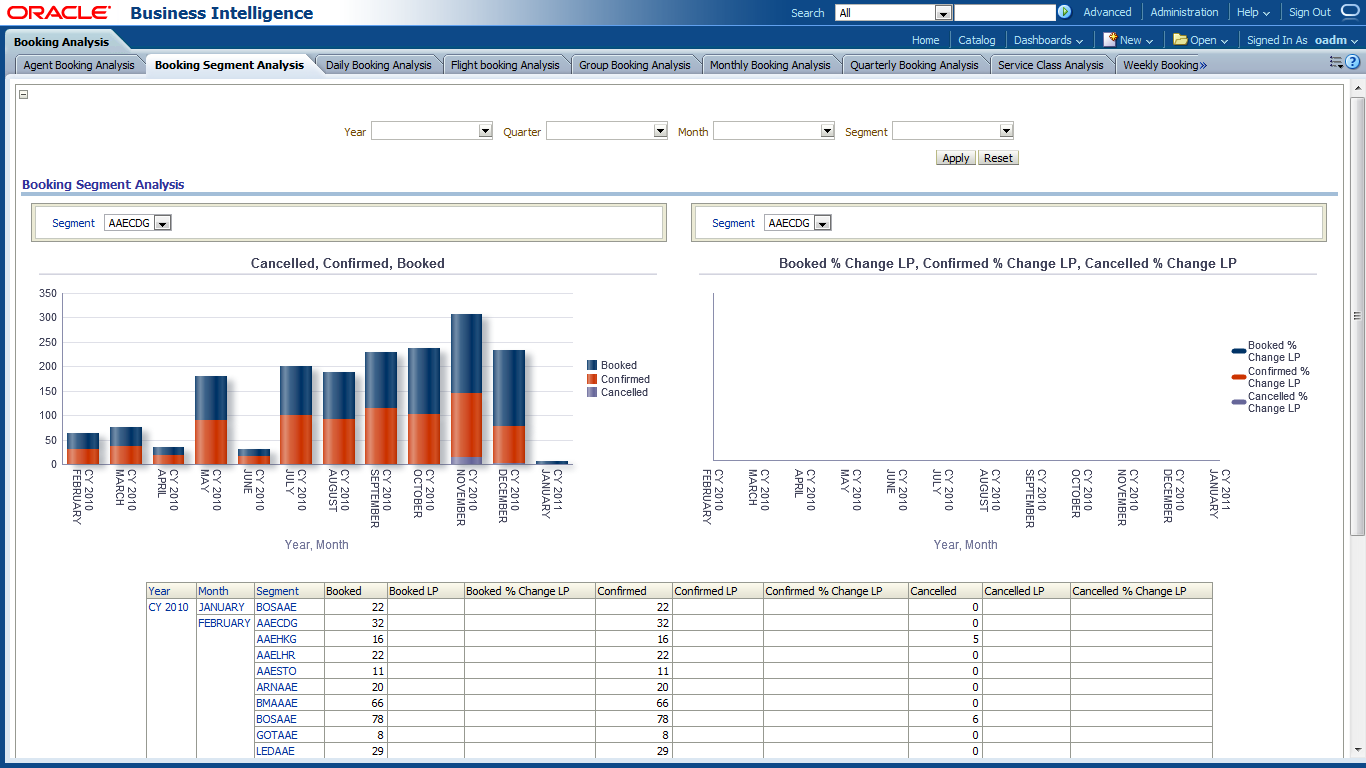
This report, as shown in Figure 11-5 provides the statistics for booking segment along with the booked tickets count, confirmed count and canceled count out of the booked at month level. The report also shows metrics such as LP, % Change LP for the booked, confirmed and canceled bookings.
Report dimensions are:
Time
Segment
Figure 11-5 Booking Segment Analysis Sample Report
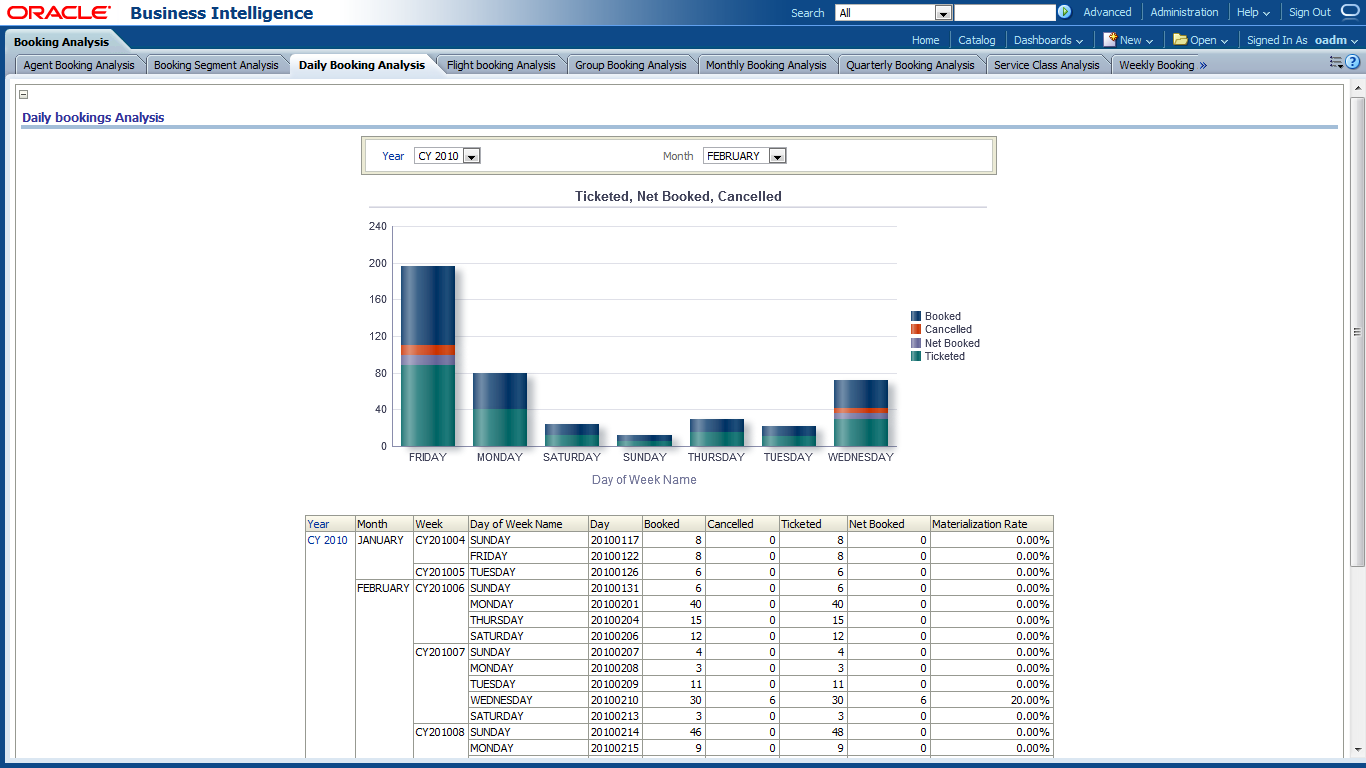
This report, as shown in Figure 11-6 provides the current year day level booking analysis of tickets. The statistics are also for how many are canceled, ticketed, net booked and materialization rate for the booked tickets.
Report dimensions are:
Time
Figure 11-6 Daily Booking Analysis Sample Report
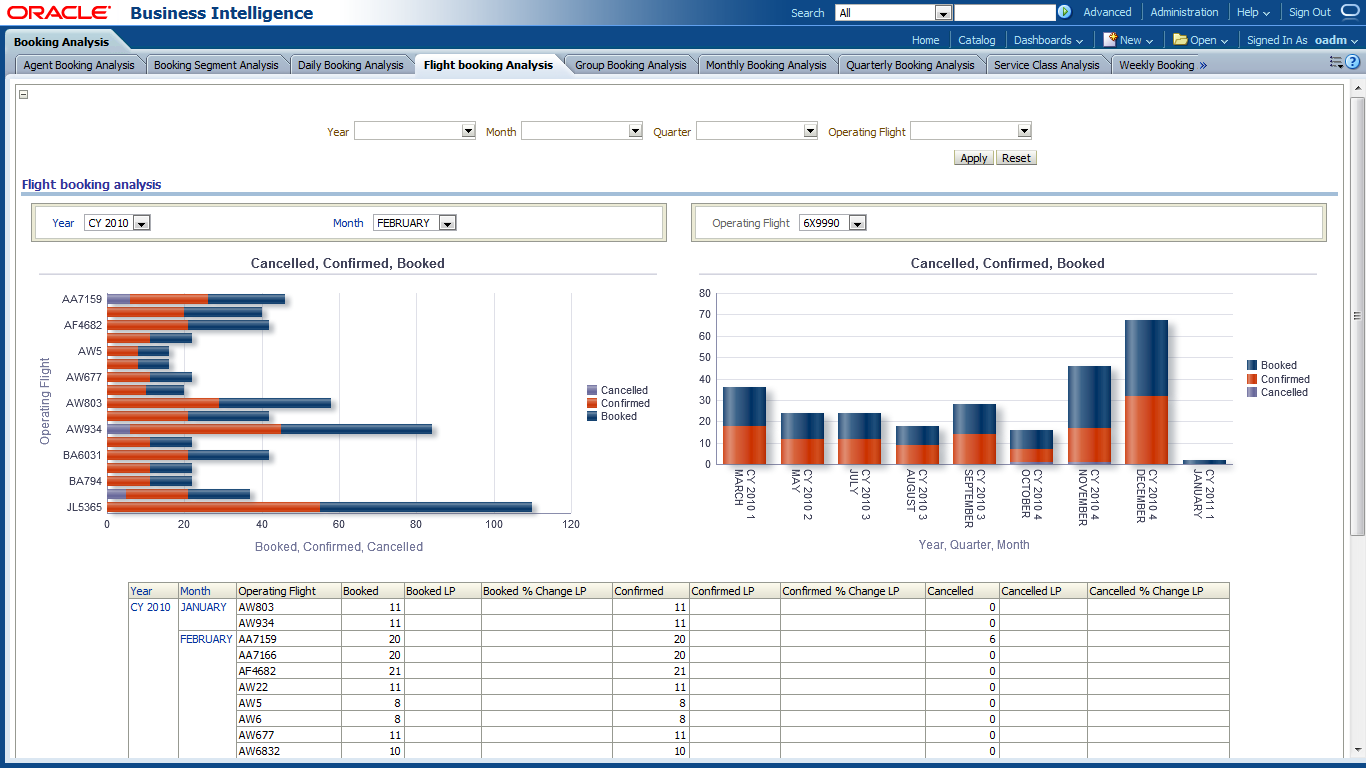
This report, as shown in Figure 11-7 provides the current year month-level flight bookings for the operating flights. The report also shows how many tickets are booked and how many are confirmed and canceled out of the booked. The report includes the metrics LP, % Change LP on Booked, Confirmed and Cancelled.
Report dimensions are:
Time
Operating Flight
Figure 11-7 Flight booking Analysis Sample Report
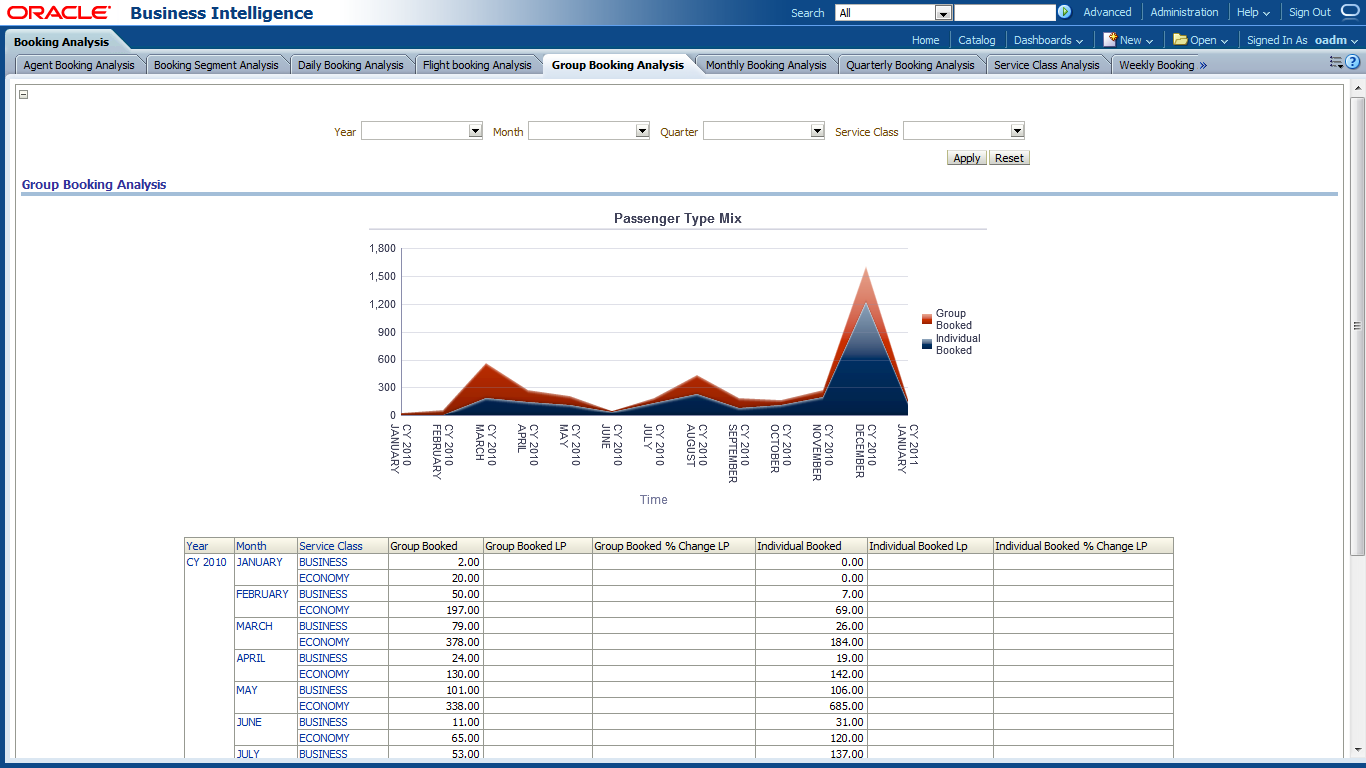
This report, as shown in Figure 11-8 provides the booking of tickets in groups at month level for different service classes. The report also includes information on individual booked tickets. The report shows metrics, including LP and % Change LP for group booked and individual booked.
Report dimensions are:
Time
Service Class
Figure 11-8 Group Booking Analysis Sample Report
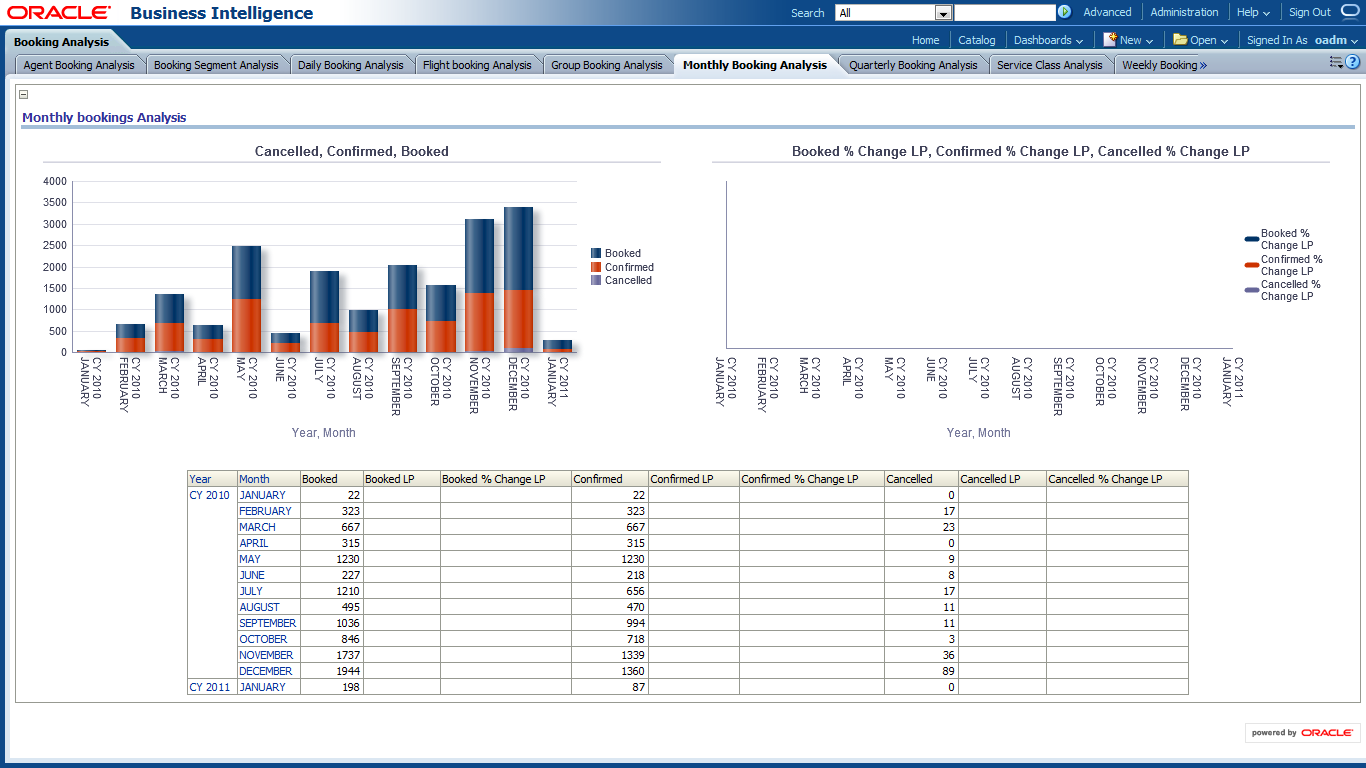
This report, as shown in Figure 11-9 provides the monthly booking analysis of the tickets. The statistics for booked, confirmed and canceled are shown. The report also shows metrics such as LP, % Change LP for booked, and confirmed and canceled tickets.
Figure 11-9 Monthly Booking Analysis Sample Report
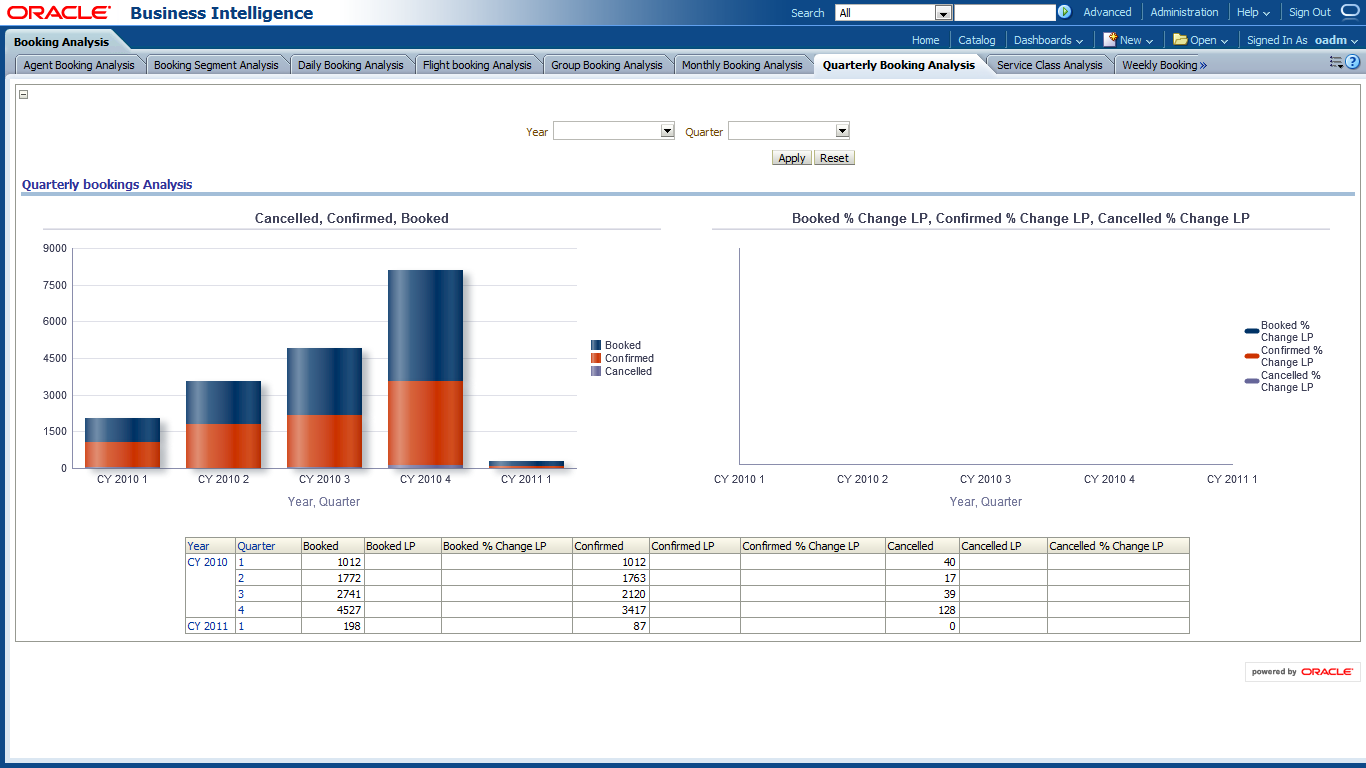
This report, as shown in Figure 11-10 provides the current year quarter level booking analysis so that you can understand which quarter has the most bookings and least bookings. The statistics on booked tickets, confirmed and canceled tickets out of the booked tickets are shown. The metrics such as LP, % Change LP or shown for the booked, confirmed and canceled tickets.
Report dimensions are:
Time
Figure 11-10 Quarterly Booking Analysis Sample Report
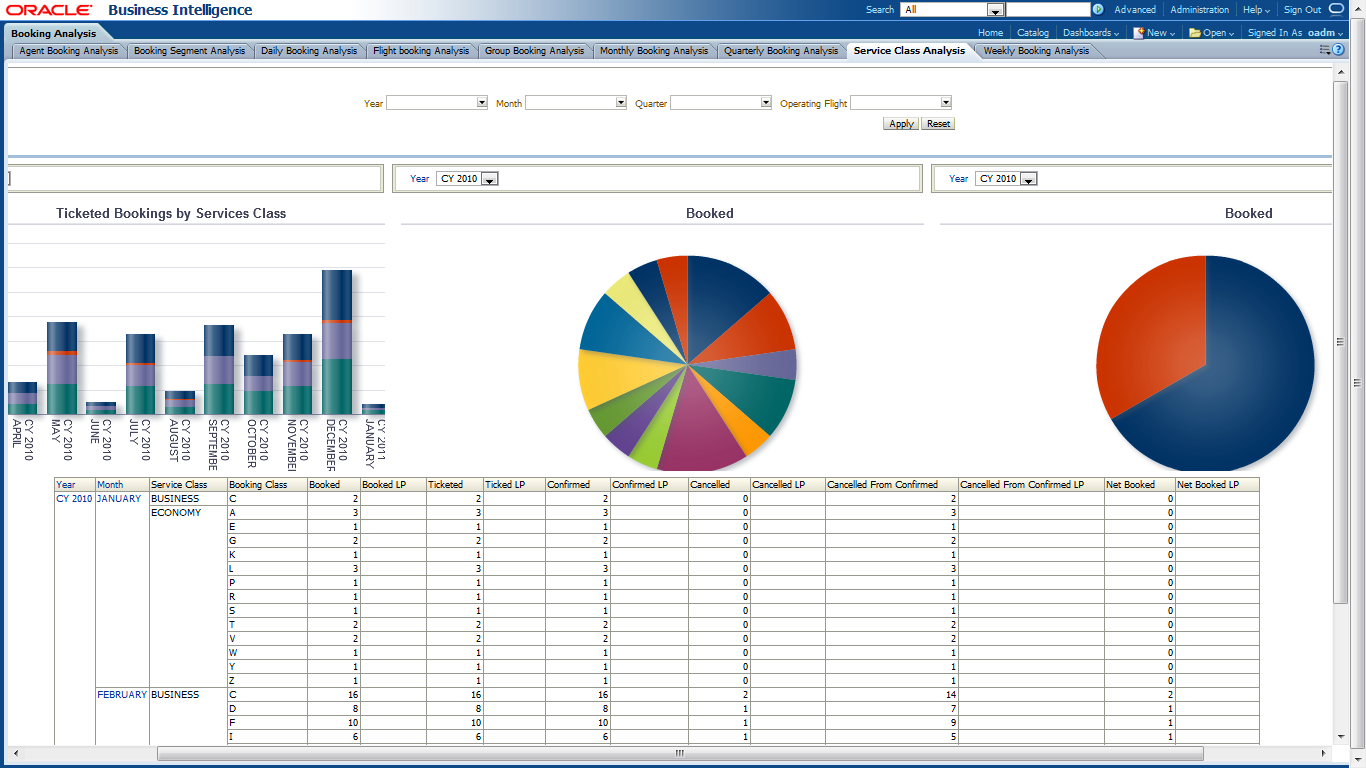
This report, as shown in Figure 11-11 provides the analysis on service class at the month level so that you can see which class is most popular. This understanding can be obtained from the information provided in booked, confirmed, canceled, canceled from conformed, net confirmed for the service class. You can also obtain information on metrics such as LP, % Change LP.
Report dimensions are:
Time
Operating Flight
Figure 11-11 Service Class Analysis Sample Report
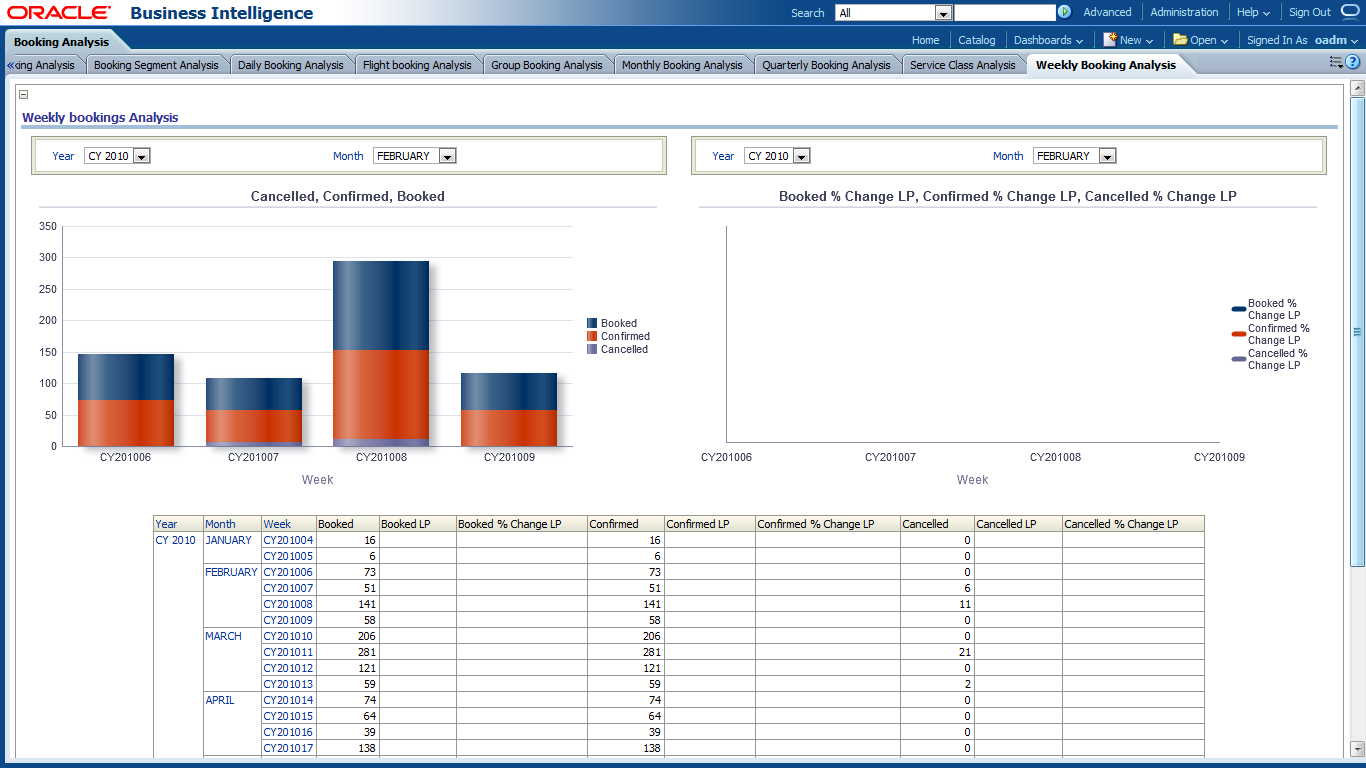
This report, as shown in Figure 11-12 provides the weekly booking analysis of tickets. The report includes information on how many tickets are booked, confirmed and canceled out of the booked at the week level. The metrics LP, % Change LP are also provided.
Report dimensions are:
Time
Figure 11-12 Weekly Booking Analysis Sample Report
The Channel Performance Analysis reports include the following areas:
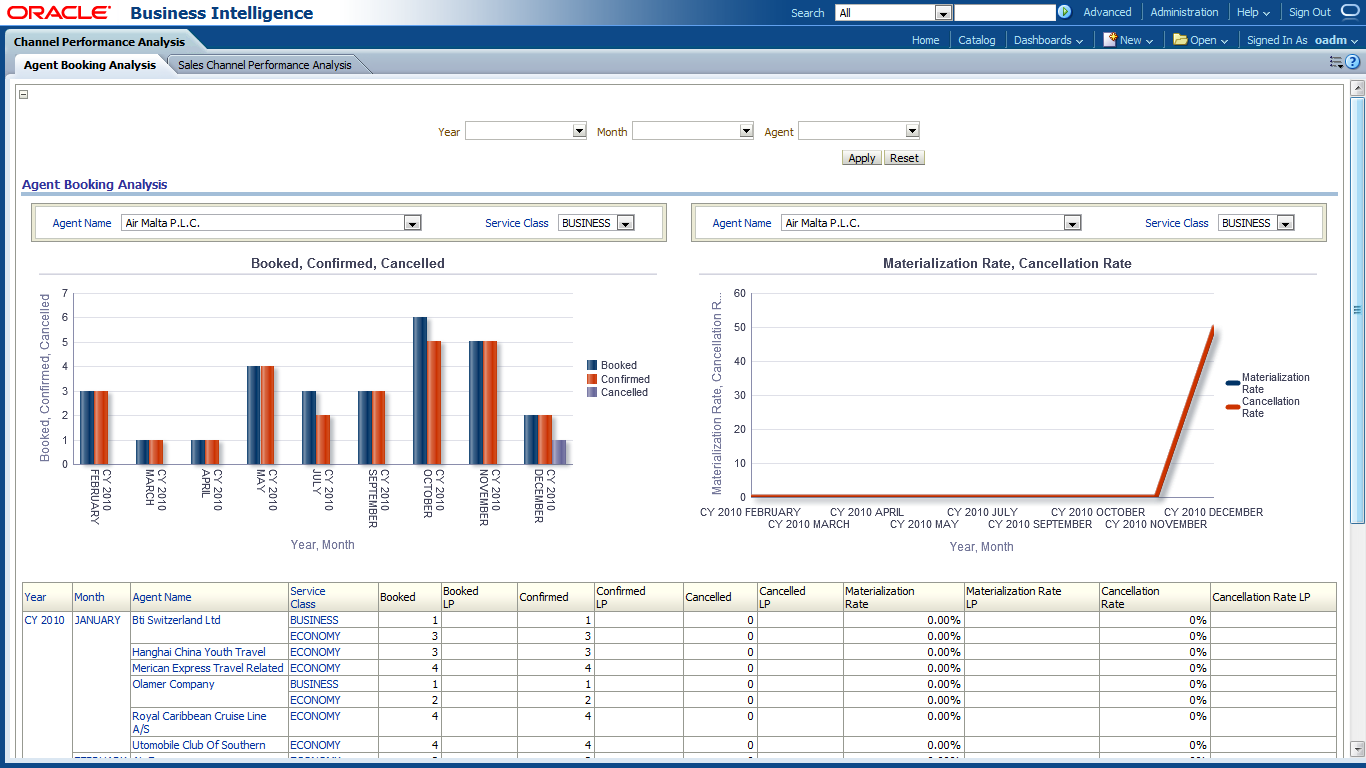
This report, as shown in Figure 11-13 provides the booking analysis of agents. The report shows information on which service class is well booked at which agent, how many are confirmed and canceled, and what is the materialization rate.
Report dimensions are:
Time
Agent
Figure 11-13 Agent Booking Analysis Sample Report
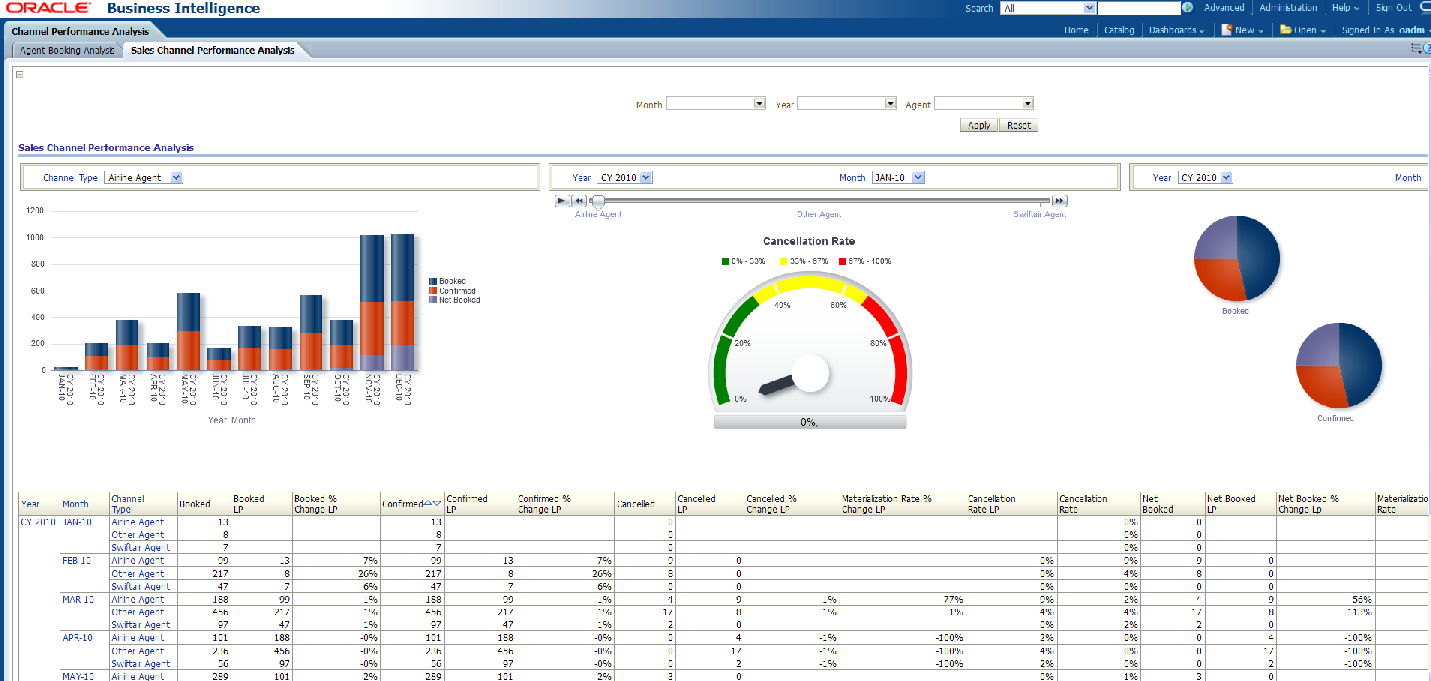
This report, as shown in Figure 11-14 provides the sales channel performance analysis.
Report dimensions are:
Time
Agent
Figure 11-14 Sales Channel Performance Analysis Sample Report
The Revenue Analysis reports include the following areas:
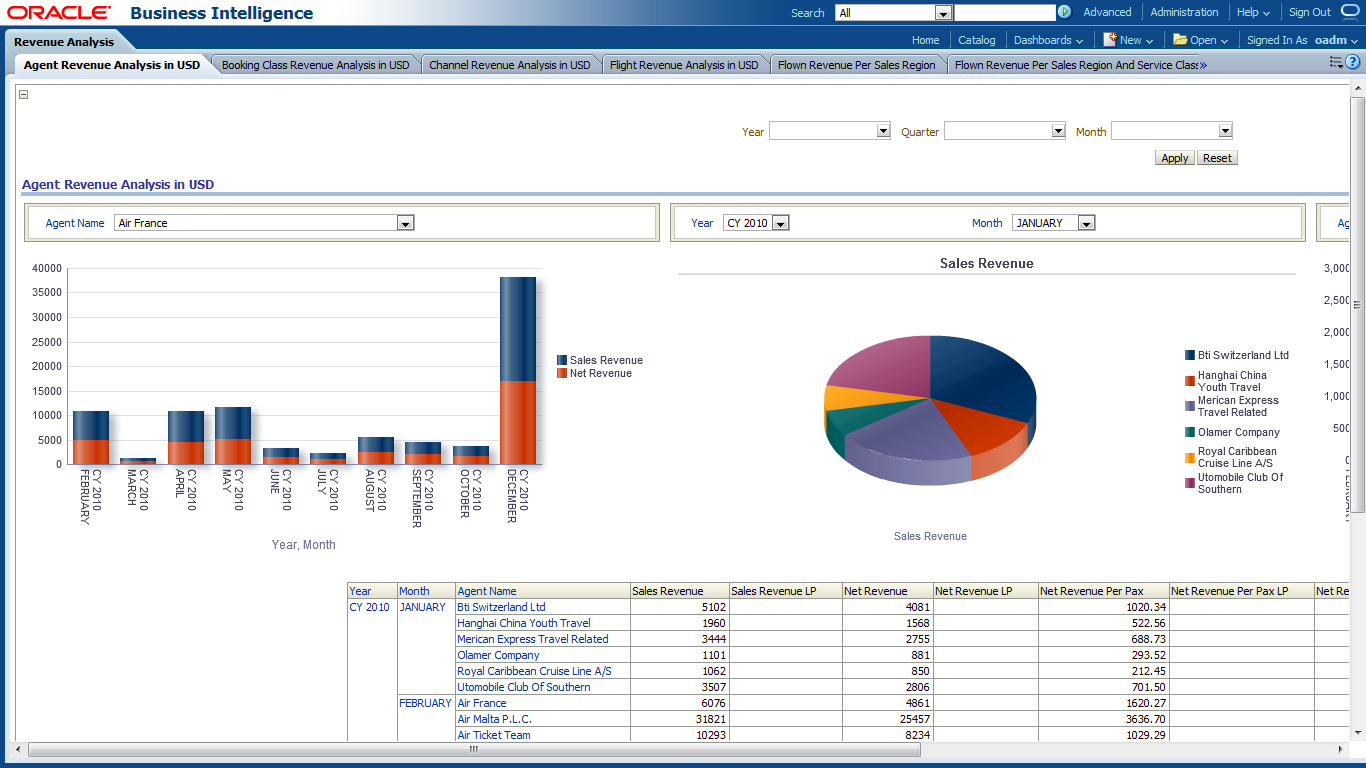
This report, as shown in Figure 11-15 provides the revenue analysis in terms of USD among the agents at the month level. This report provides information that allows you to determine agents that are performing well. The report also provides information on sales revenue, net revenue, and the LP, and % Change LP metrics.
Report dimensions are:
Time
Figure 11-15 Agent Revenue Analysis in USD Sample Report
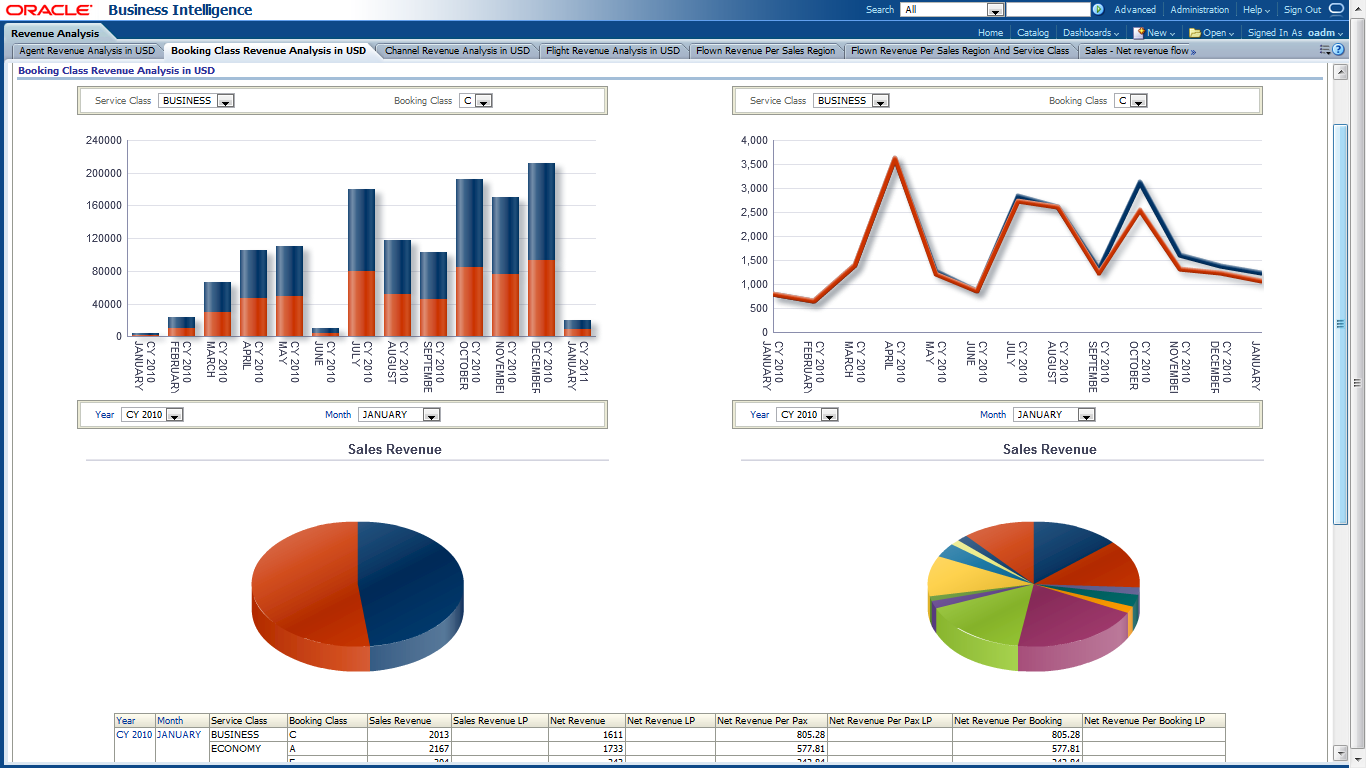
This report, as shown in Figure 11-16 provides the revenue analysis for booking class in USD. This provides information so that you can determine which booking class is well used under which service class. The report also provides metrics for net revenue, sales revenue, LP, and % Change LP metrics.
Report dimensions are:
Time
Figure 11-16 Booking Class Revenue Analysis in USD Sample Report
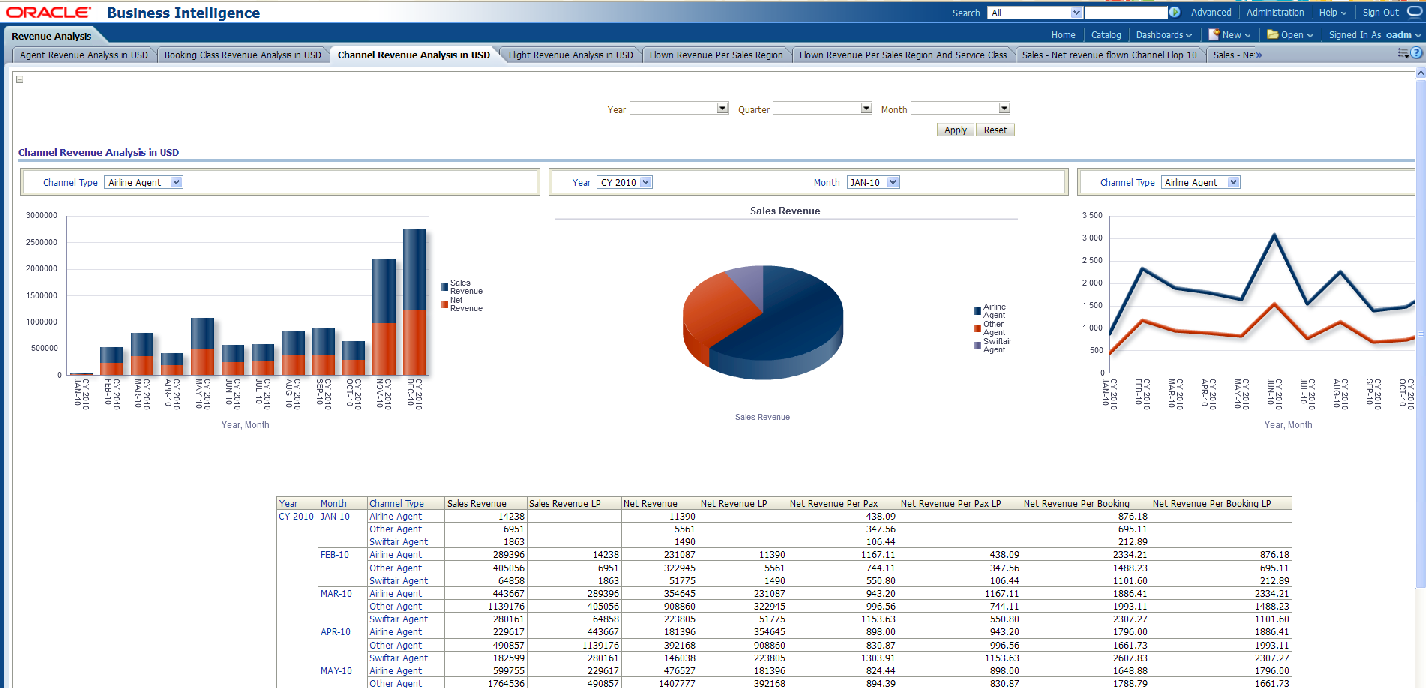
This report, as shown in Figure 11-17 provides the channel revenue analysis in USD.
Report dimensions are:
Time
Figure 11-17 Channel Revenue Analysis in USD Sample Report
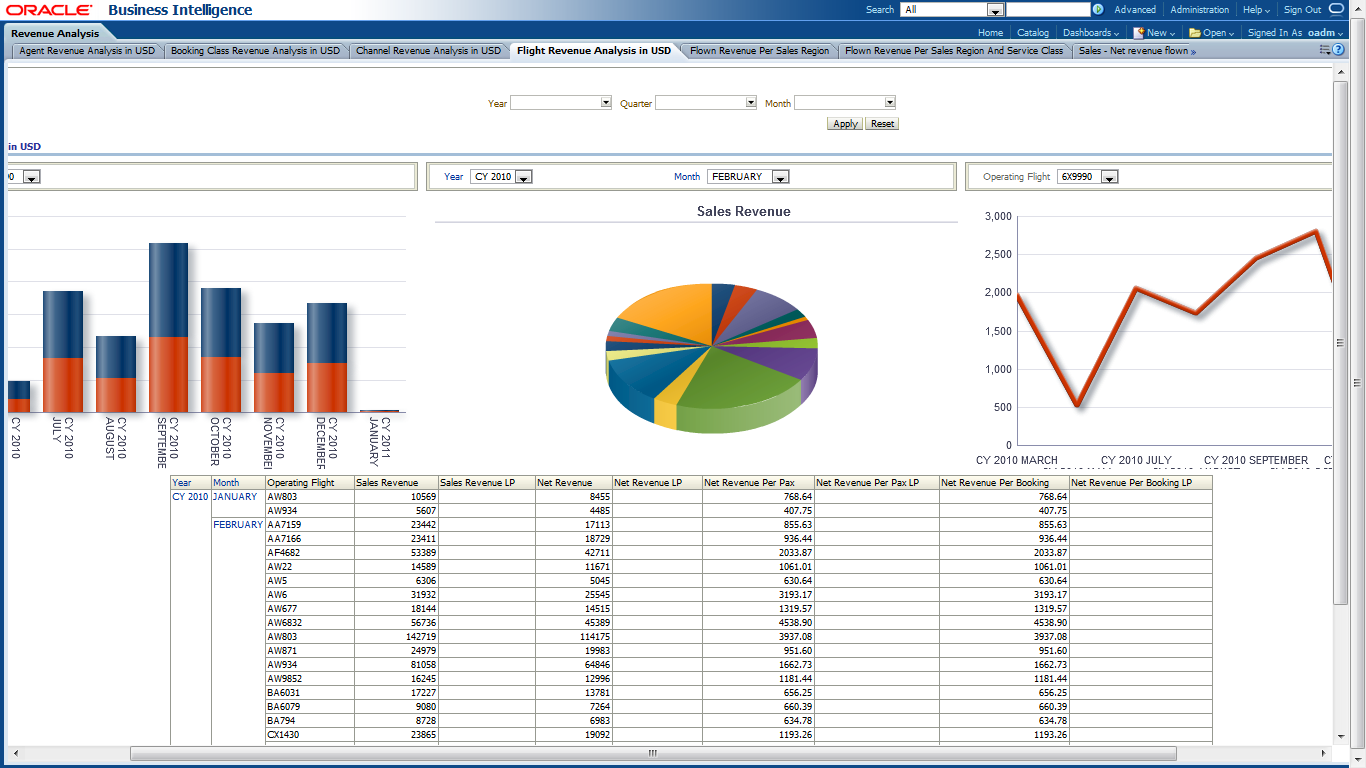
This report, as shown in Figure 11-18 provides the revenue analysis in USD for flights at month level. The report shows which revenue per operating flight. The report also includes information on net revenue, sales revenue, and the metrics LP, and % Change LP.
Report dimensions are:
Time
Figure 11-18 Flight Revenue Analysis in USD Sample Report
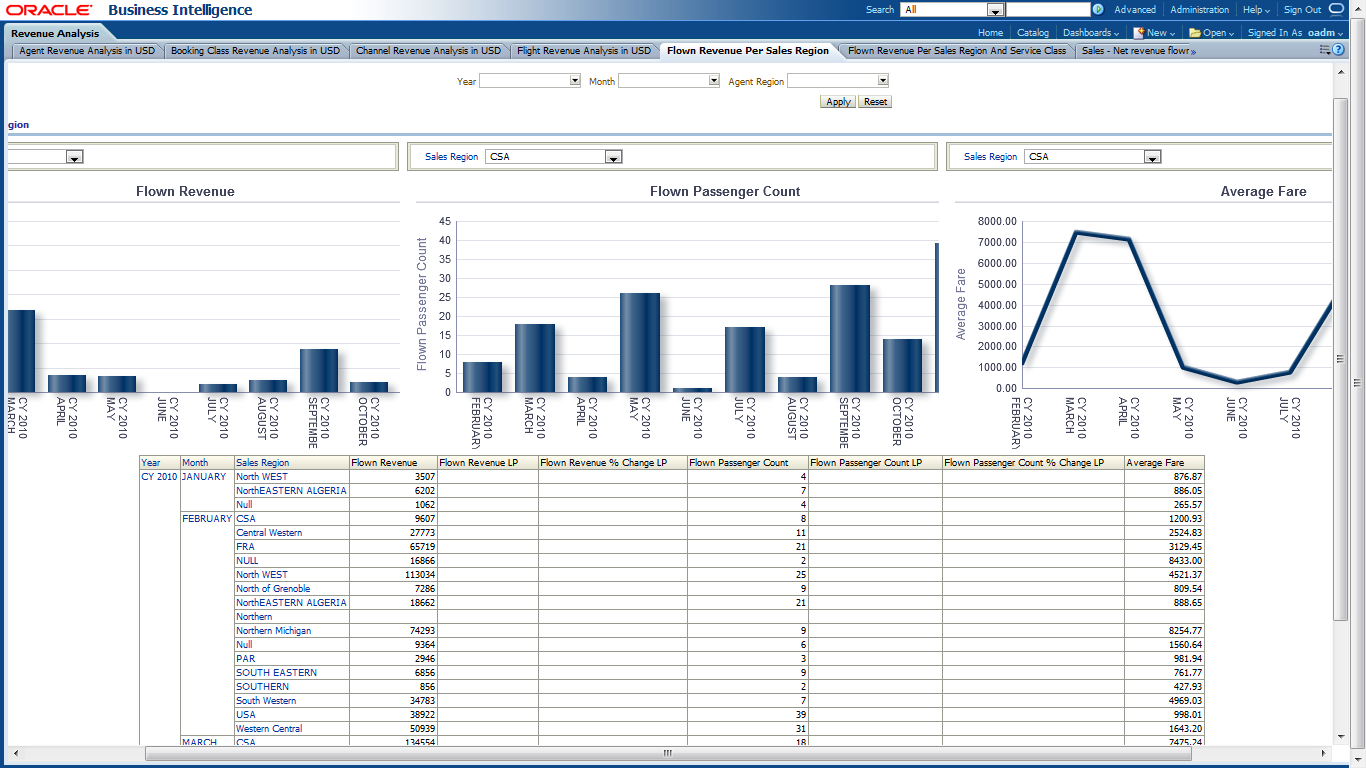
This report, as shown in Figure 11-19 provides the current year month level flown revenue for sales regions. The information is obtained for flown revenue, flown passenger count and average fare for the sales regions along with LP, % Change LP. This report information help you determine which region has the most revenue.
Report dimensions are:
Time
Agent Region
Figure 11-19 Flown Revenue per Sales Region Sample Report
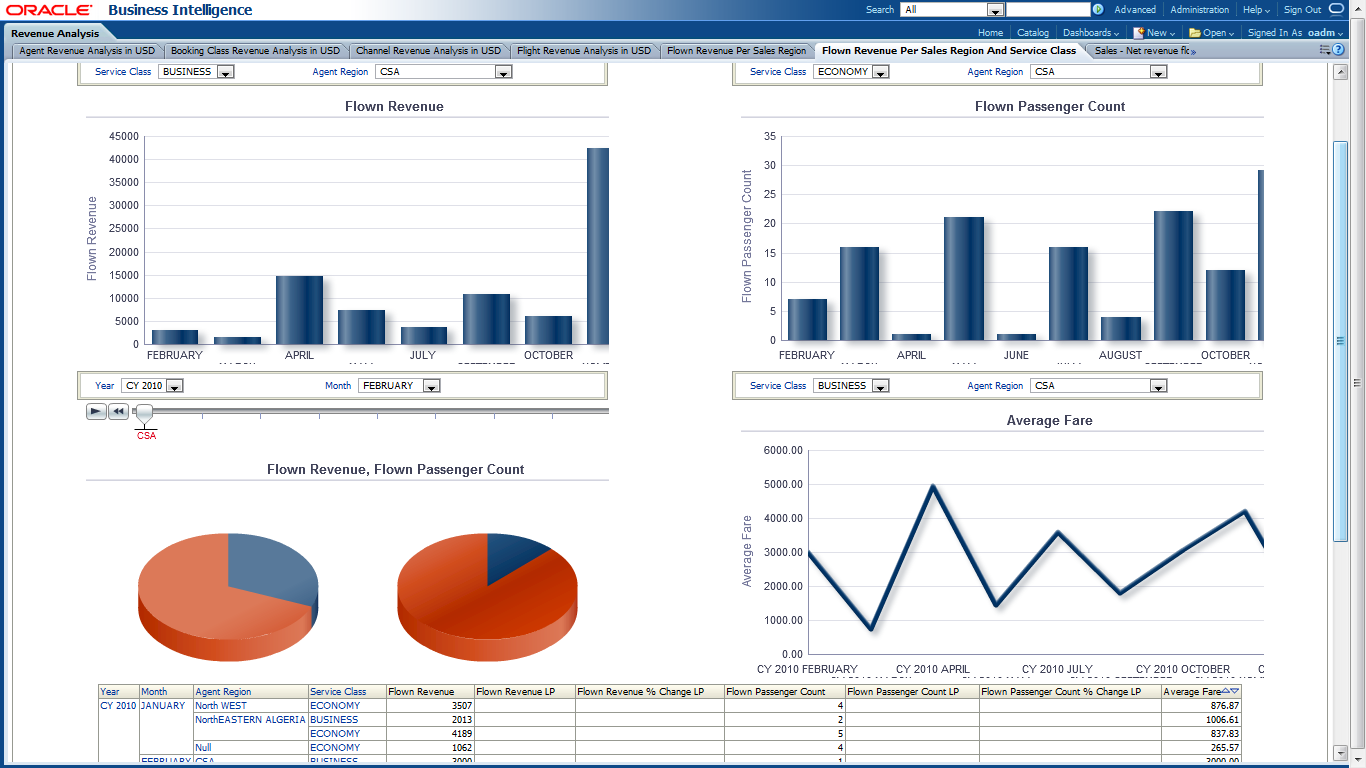
This report, as shown in Figure 11-20 provides the flown revenue per sales region and service class. The report information is on the flight revenue, flight passenger count and average fare along with the metrics of LP, % Change LP for the flight revenue and flight passenger count. The information in this report help you determine which sales region and which service class has higher revenue.
Report dimensions are:
Time
Agent Region
Service Class
Figure 11-20 Flown Revenue Per Sales Region and Service Class Sample Report
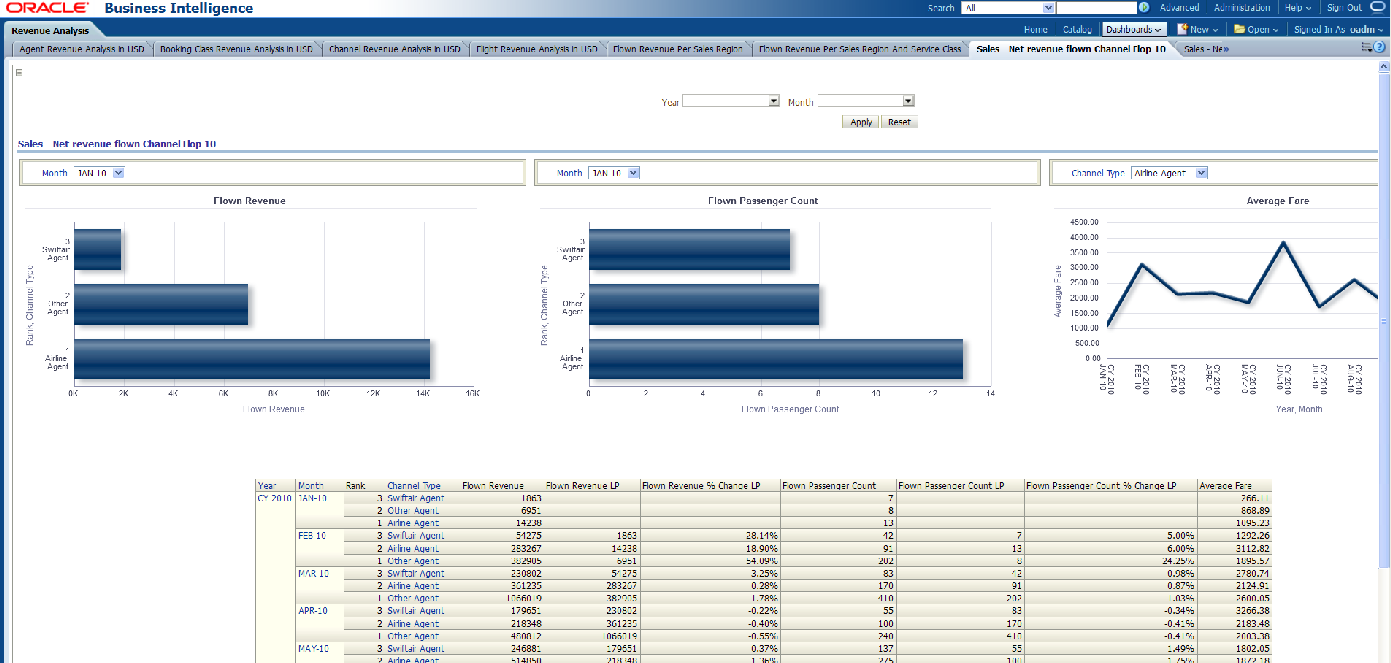
This report, as shown in Figure 11-21 provides the Sales, Net Revenue Flown Channel Flop 10 report.
Report dimensions are:
Time
Figure 11-21 Sales - Net Revenue Flown Channel Flop 10
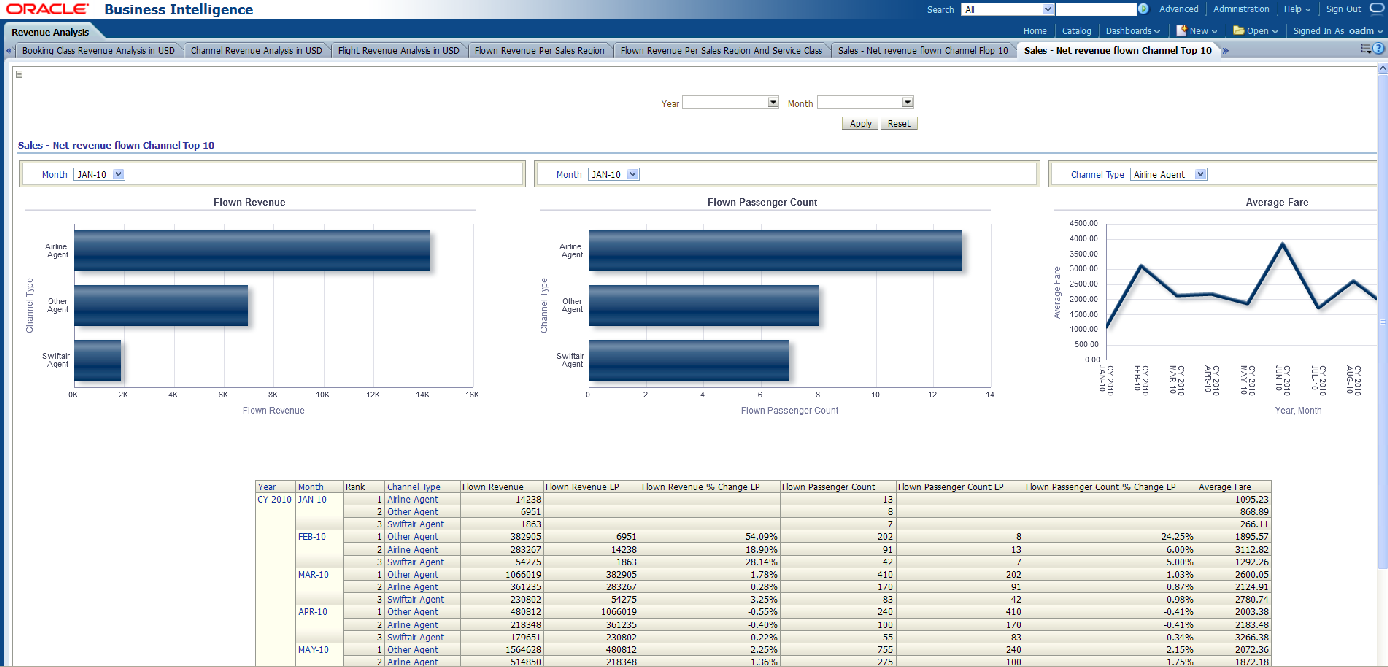
This report, as shown in Figure 11-22 provides the sales net revenue flown channel by channel type.
Report dimensions are:
Time
Figure 11-22 Net Revenue Flown Channel Top 10 Sample Report
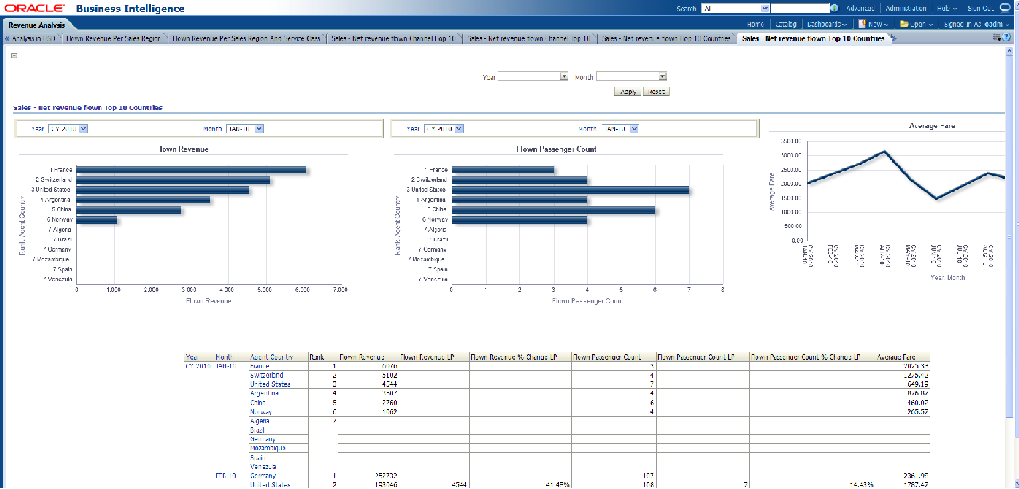
This report, as shown in Figure 11-23 provides information on flown passenger counts by country.
Report dimensions are:
Time
Figure 11-23 Net revenue flown Flop 10 Countries Sample Report
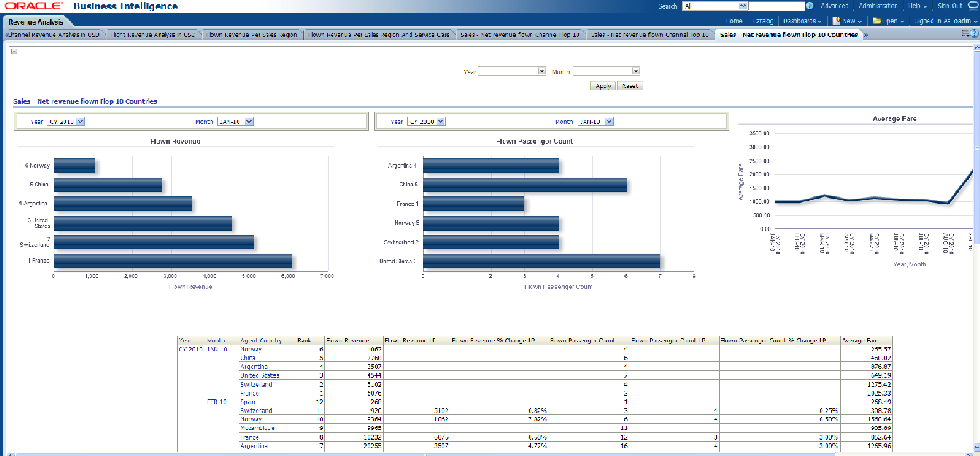
This report, as shown in Figure 11-24 provides the net revenue flown for the top ten countries.
Report dimensions are:
Time
Figure 11-24 Sales - Net revenue flown Top 10 Countries Sample Report
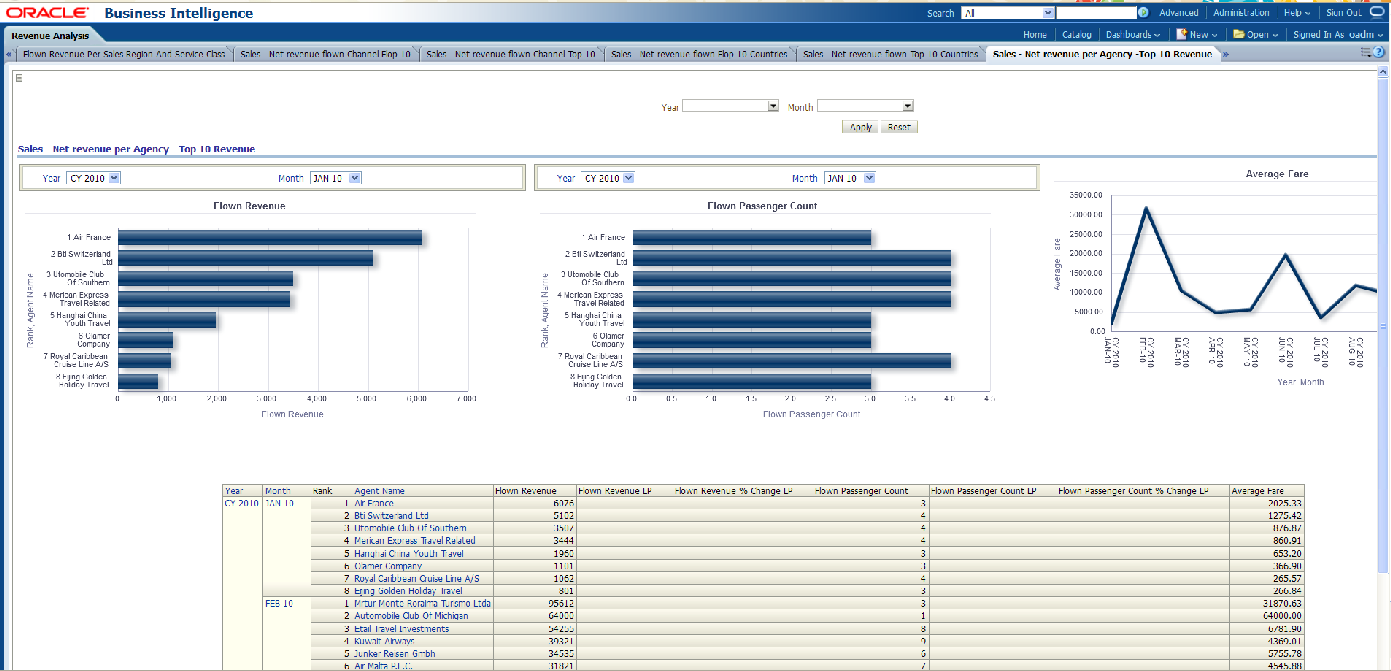
This report, as shown in Figure 11-25 provides the sales net revenue per top ten agency.
Report dimensions are:
Time
Figure 11-25 Sales - Net Revenue Per Agency - Top 10 Revenue Sample Report
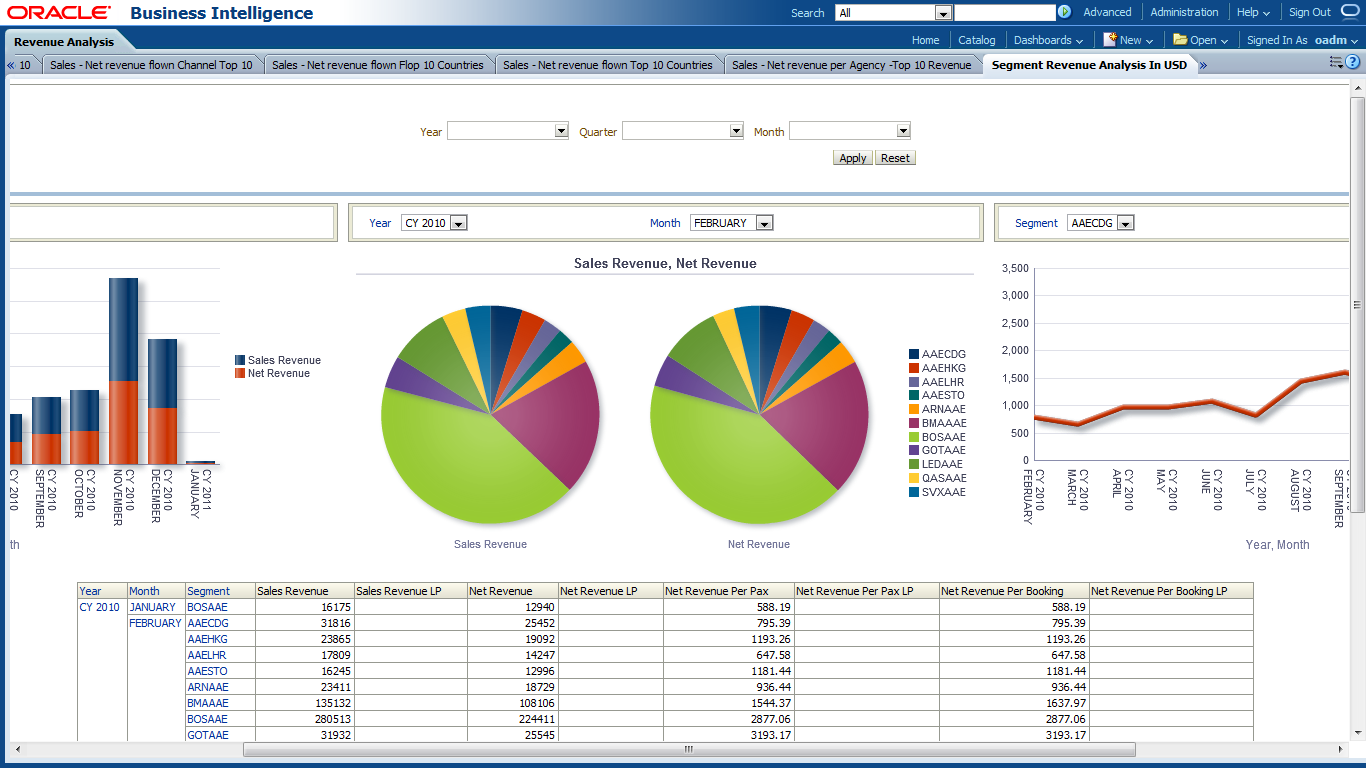
This report, as shown in Figure 11-26 provides the information on revenue analysis segment wise in month level. The statistics on sales revenue, net revenue, net revenue per pax, net revenue per booking is available along with LP metrics. This reports can help you determine which segment is well used based on revenue.
Report dimensions are:
Time
Figure 11-26 Segment Revenue Analysis in USD Sample Report
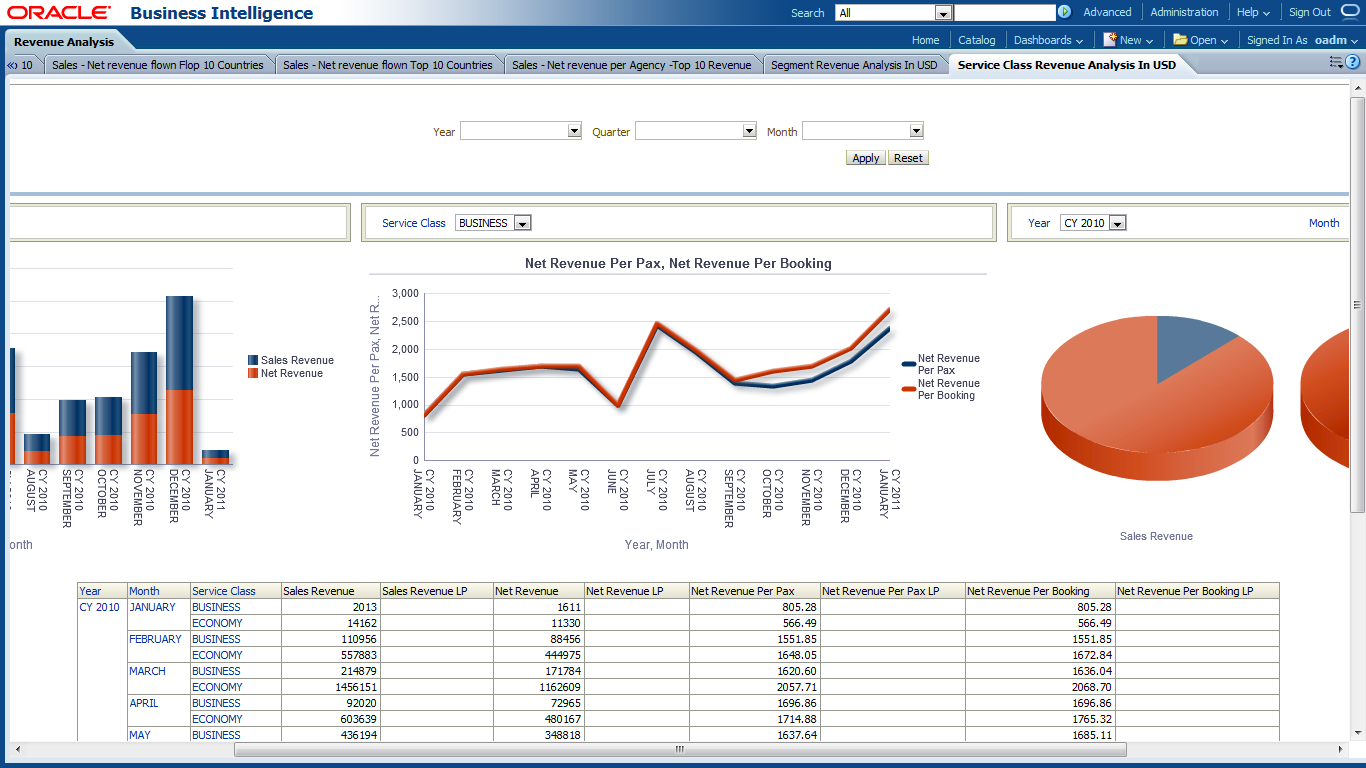
This report, as shown in Figure 11-27 provides the month level revenue analysis on service class in USD. The report shows that out of all the service classes available, class usage and revenue per service class. The report also shows metrics such as LP for sales revenue, net revenue, net revenue per pax and net revenue for booking.
Report dimensions are:
Time
Figure 11-27 Service Class Revenue Analysis in USD Sample Report
The Route Analysis Reports are includes one report:
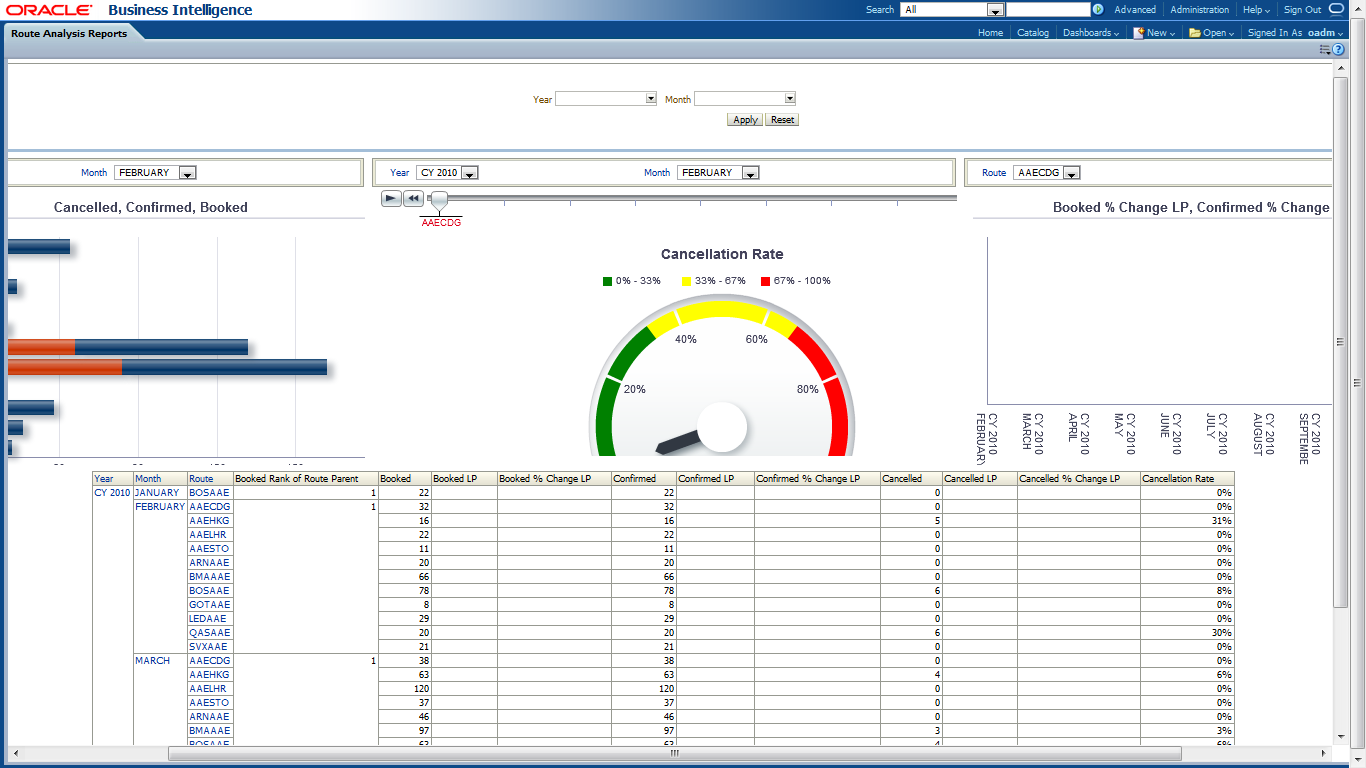
This report, as shown in Figure 11-28 provides the information on rankings of routes based on bookings at month level. The report shows the statistics for booked, confirmed and canceled, along with the metrics LP, % Change LP for booked, confirmed and canceled. Based on the booking statistics, the report provides ranks for the routes. The report also shows the cancellation rate for the particular route.
Report dimensions are:
Time
Figure 11-28 Route Ranking on Bookings Sample Report
The Call Center Performance Analysis reports include the following areas:
Call Center Performance
Call Center Sales Performance
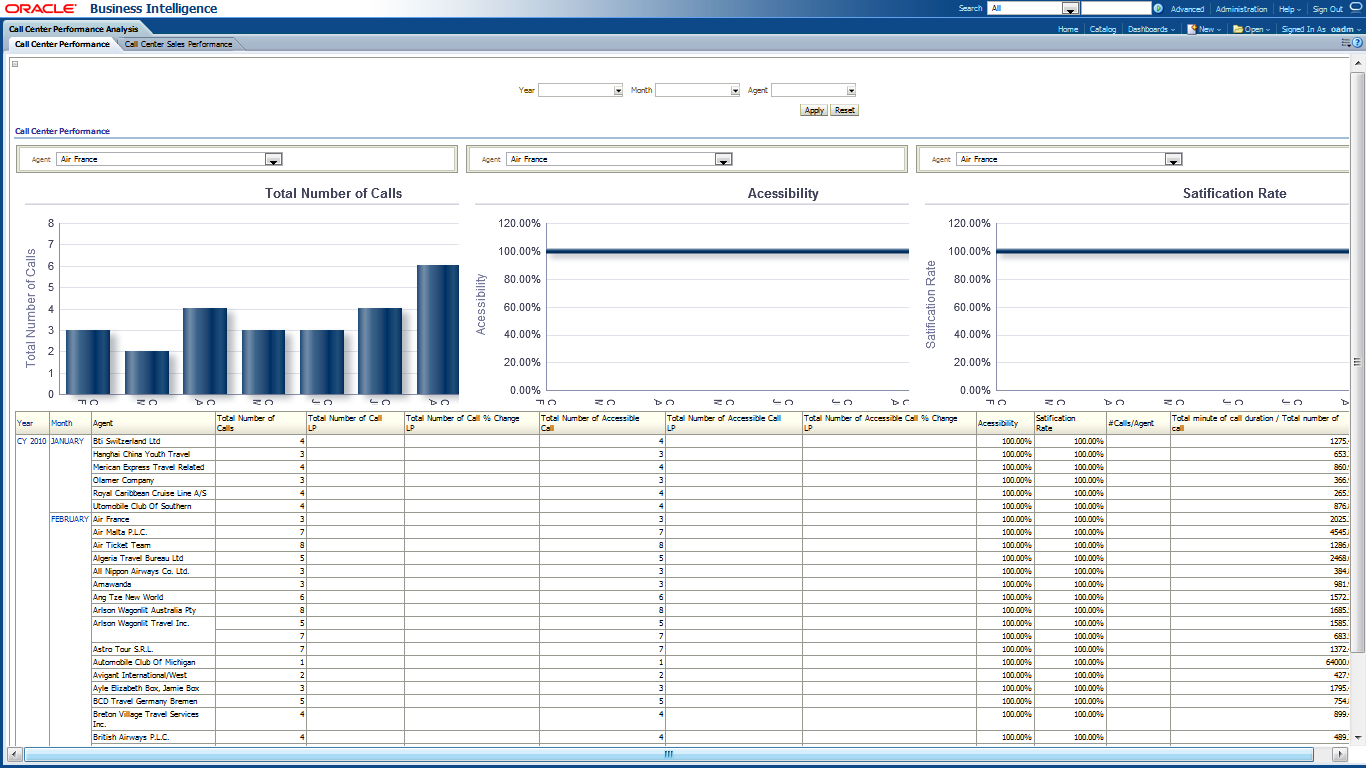
This report, as shown in Figure 11-29 provides the year wise month level call center performance agents wise. The report includes the total number of calls and how many are accessible calls out the total calls. The metrics like LP, % Change LP for the total number of calls and accessible calls can be obtained from this report.
Report dimensions are:
Time
Agent
Figure 11-29 Call Center Performance Sample Report
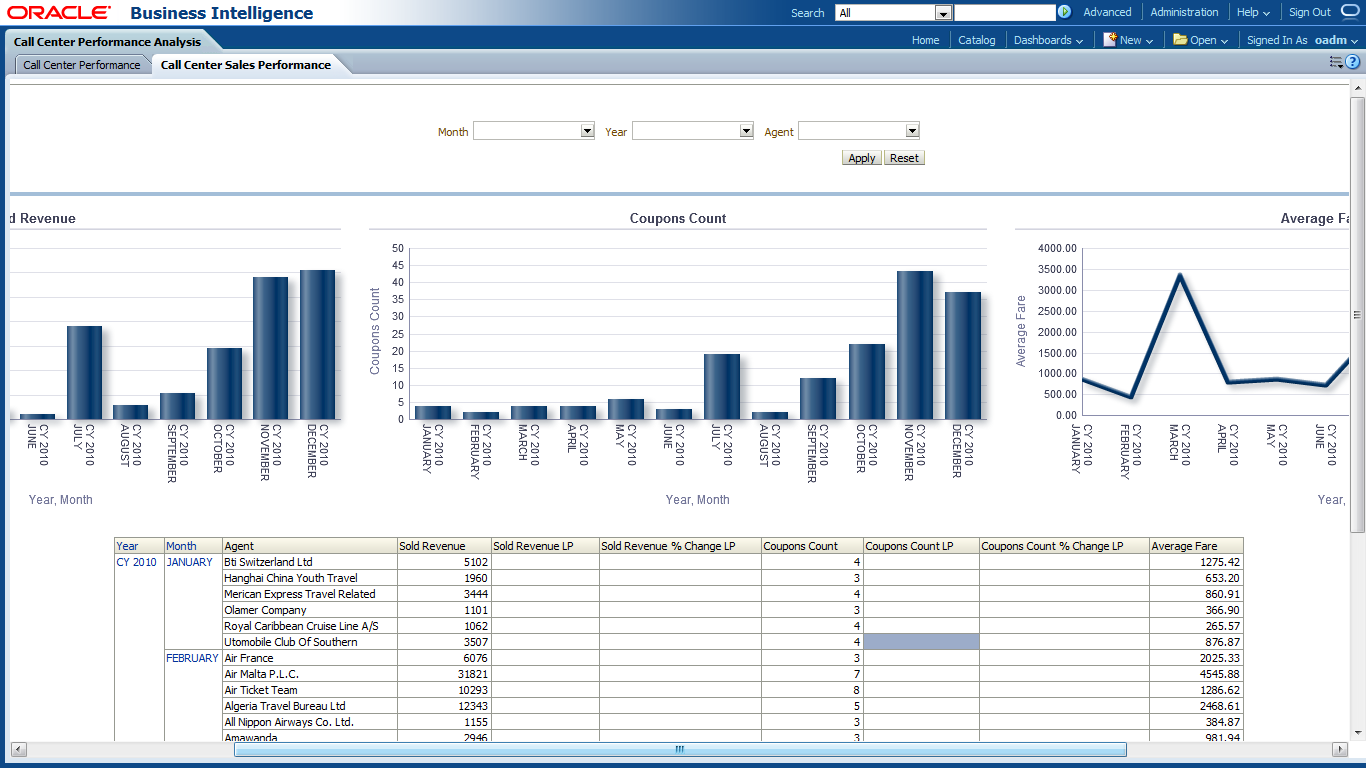
This report, as shown in Figure 11-30 provides the current year month level sales performance for the call centers for all the agents. The report includes information on the sold revenue and the count of coupons. This report also shows metrics LP and % Change LP for the Sold revenue and Coupons count.
Report dimensions are:
Time
Agent
Figure 11-30 Call Center Sales Performance Sample Report
The Customer Loyalty Analysis reports include the following areas:
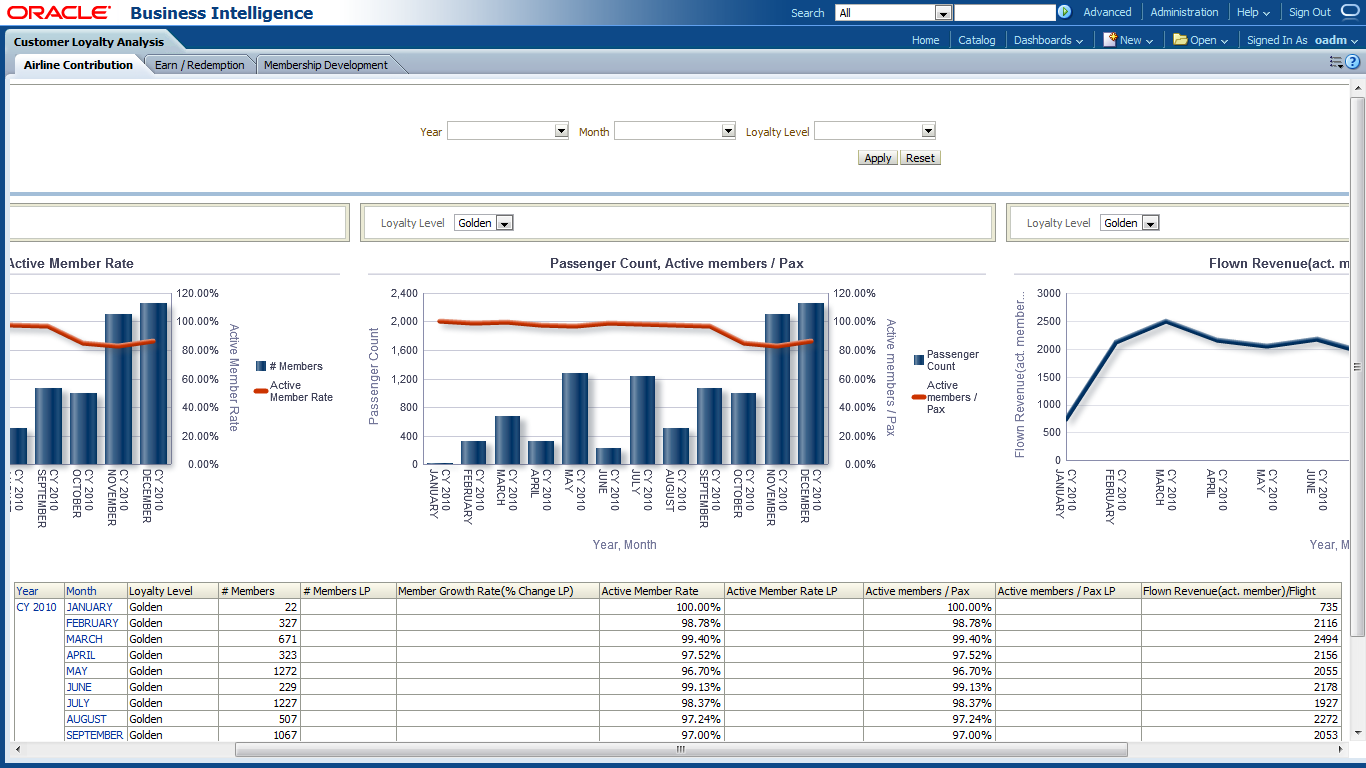
This report, as shown in Figure 11-31 provides the year wise month level information on airline contribution, that is, how many members are there, how many are active out the total members, what is their growth rate, what is the passengers count and the rate of active members, Active members/Pax, and so on. The metrics like LP, % Change LP for members, active members are also obtained.
Report dimensions are:
Time
Loyalty Level
Figure 11-31 Airline Contribution Sample Report
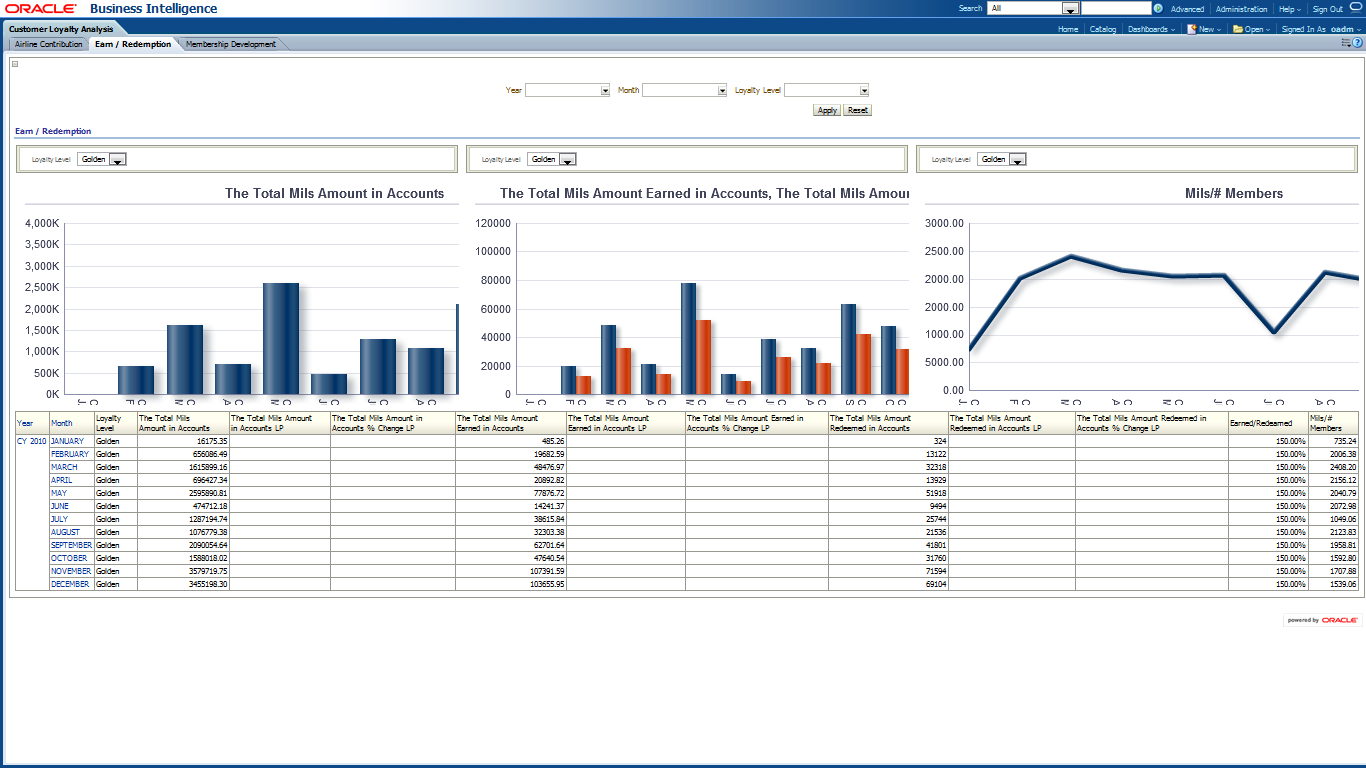
This report, as shown in Figure 11-32 provides the current year month level earnings and redemptions. The report includes the total mils amount in accounts, total mils amount earned, and redeemed in the accounts. This report also provides the metrics LP, % Change LP for the total mils amount in accounts, total mils amount earned in accounts and total mils amount redeemed in account.
Report dimensions are:
Time
Loyalty Level
Figure 11-32 Earn / Redemption Sample Report
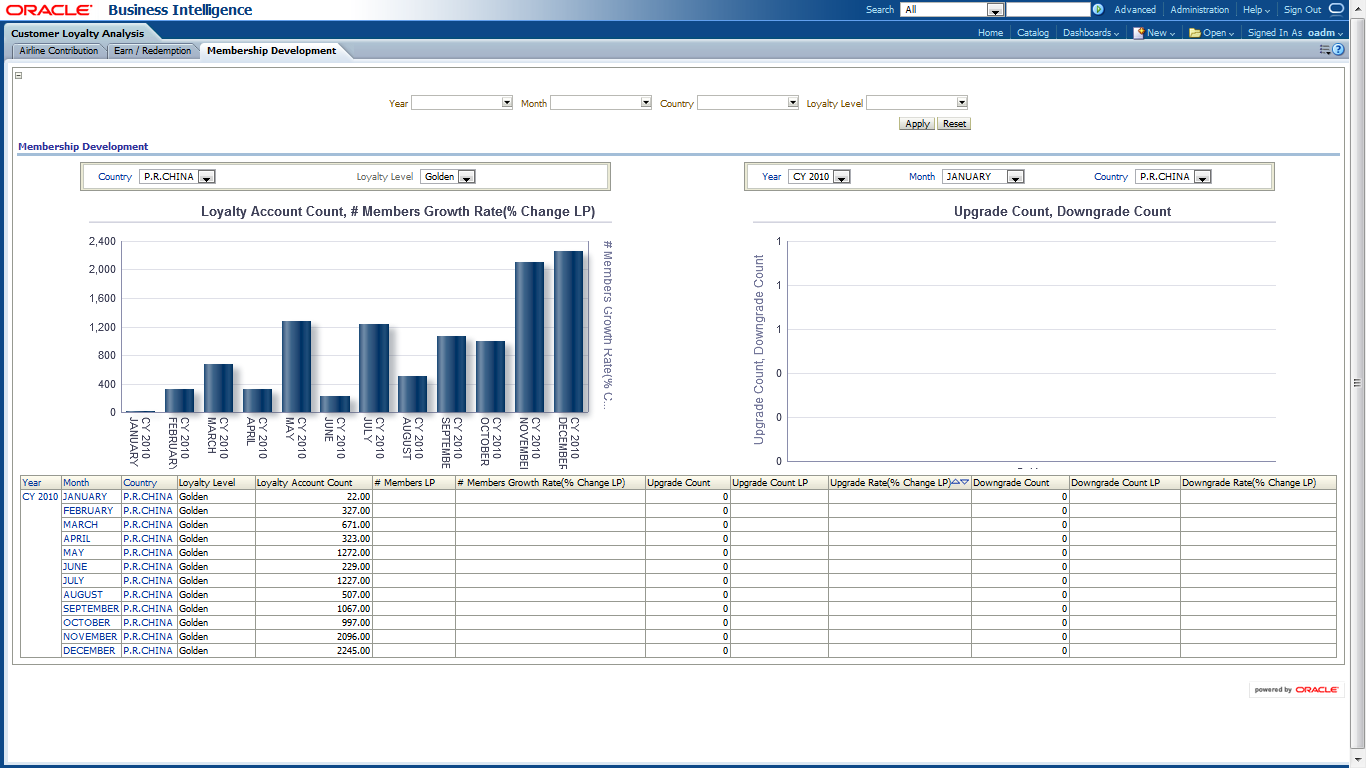
This report, as shown in Figure 11-33 provides the membership development for the current year month level basing on loyalty level in different countries. This report provides information on the number of members, how many members are upgraded and degraded. The report also shows the metrics LP and % Change LP for the members' growth rate, upgrade count, and downgrade count.
Report dimensions are:
Time
Country
Loyalty Level
Figure 11-33 Membership Development Sample Report
The Frequent Flyer Customer Mining reports include the following areas:
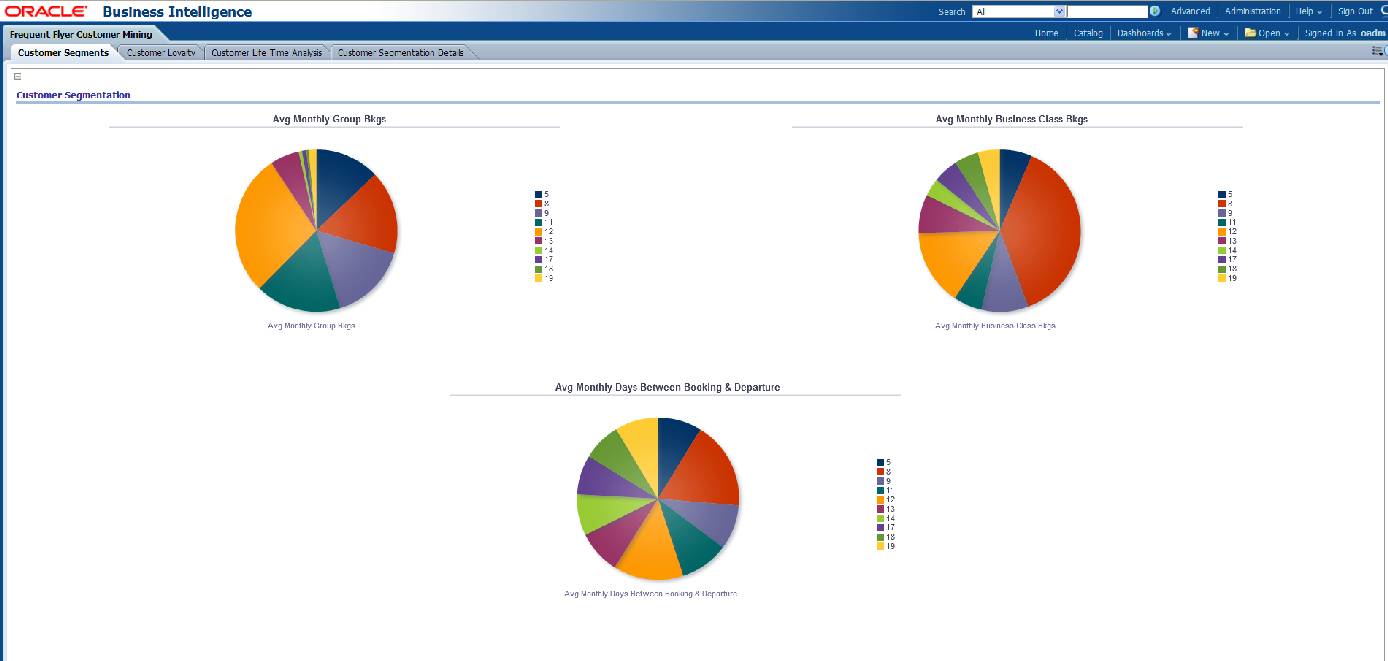
This report, as shown in Figure 11-34 provides the frequent flyer customer mining report for segments.
Figure 11-34 Frequent Flyer Customer Mining Customer Segments
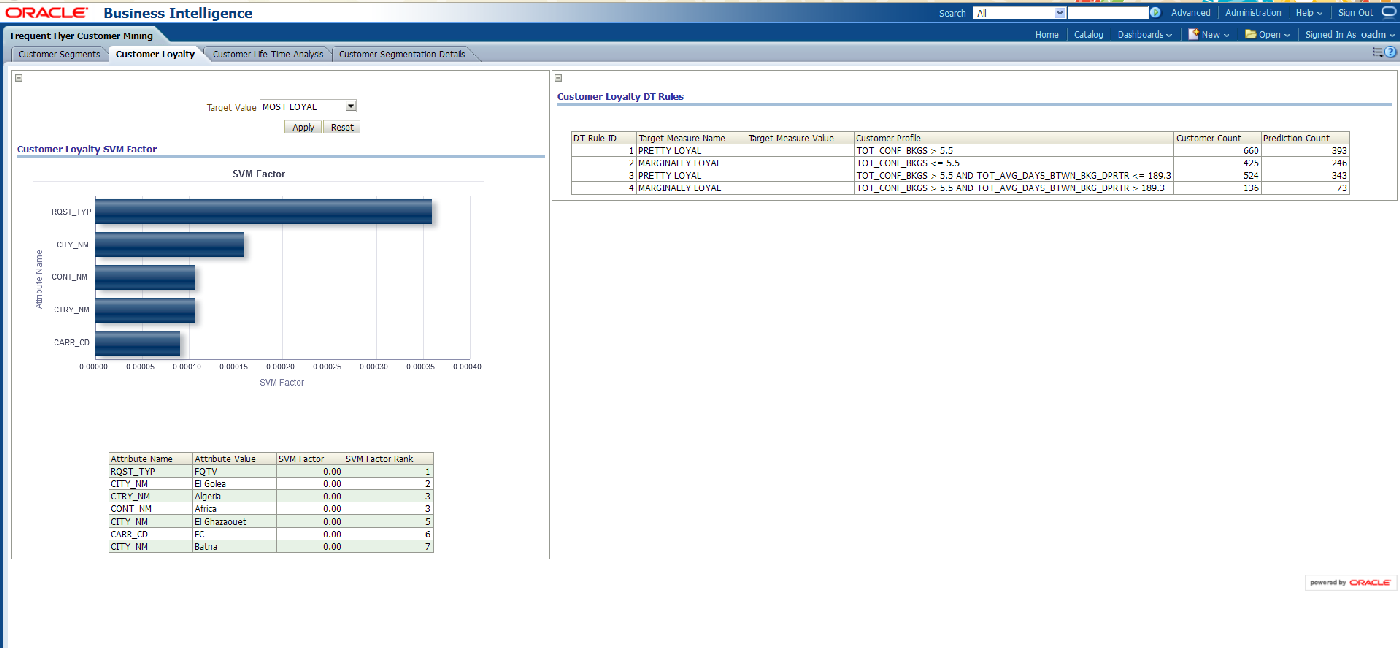
This report, as shown in Figure 11-35 provides the frequent flyer customer mining for customer loyalty.
Report dimensions are:
Target Value
Figure 11-35 Frequent Flyer Customer Mining Customer Loyalty Sample Report
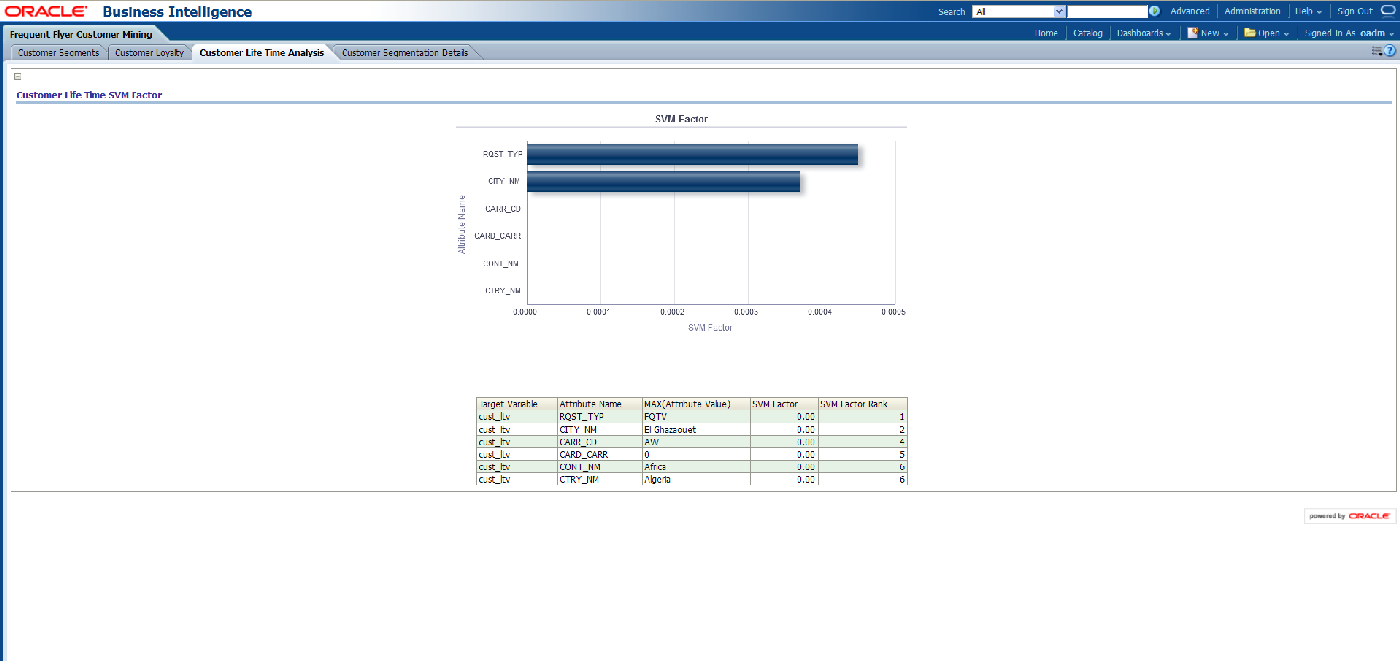
This report, as shown in Figure 11-36 provides the frequent flyer customer mining report for expected customer life time.
Figure 11-36 Frequent Flyer Customer Mining: Customer Life Time Analysis Sample Report
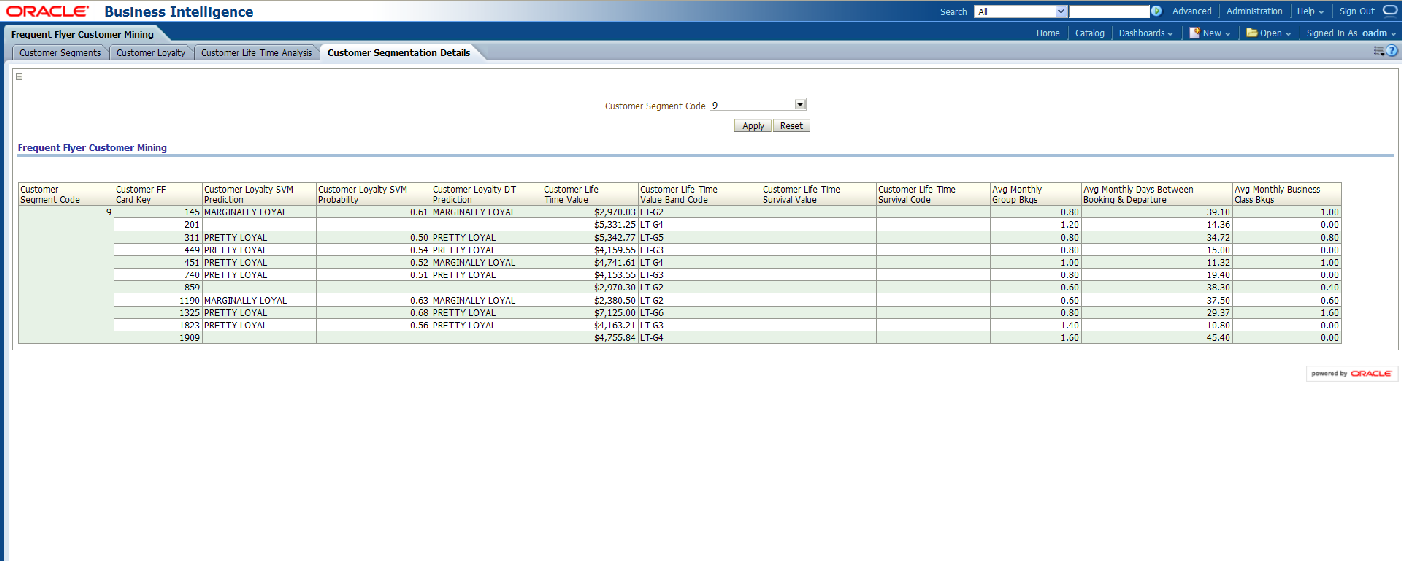
This report, as shown in Figure 11-37 provides the frequent flyer customer mining report for customer segmentation.
Report dimensions are:
Customer Segment Code
Figure 11-37 Frequent Flyer Customer Mining: Customer Segmentation Details Report
Non-Frequent Flyer Customer Mining
This Non-Frequent Flyer Customer Mining reports include the following areas:
FFP Prediction In Non-FFP Customers
Non-FFP Customer Mining Overall
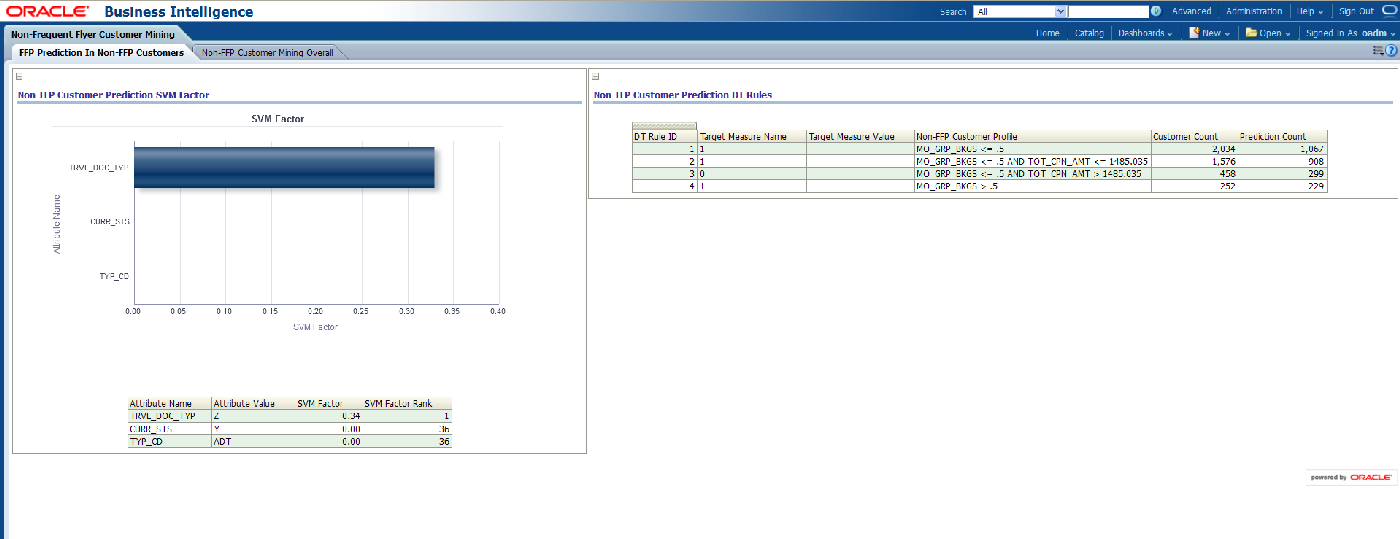
This report, as shown in Figure 11-38 provides the Non-Frequent Flyer Customer Mining FFP Prediction Sample Report.
Figure 11-38 Non-Frequent Flyer Customer Mining FFP Prediction In Non-FFP Customers Sample Report
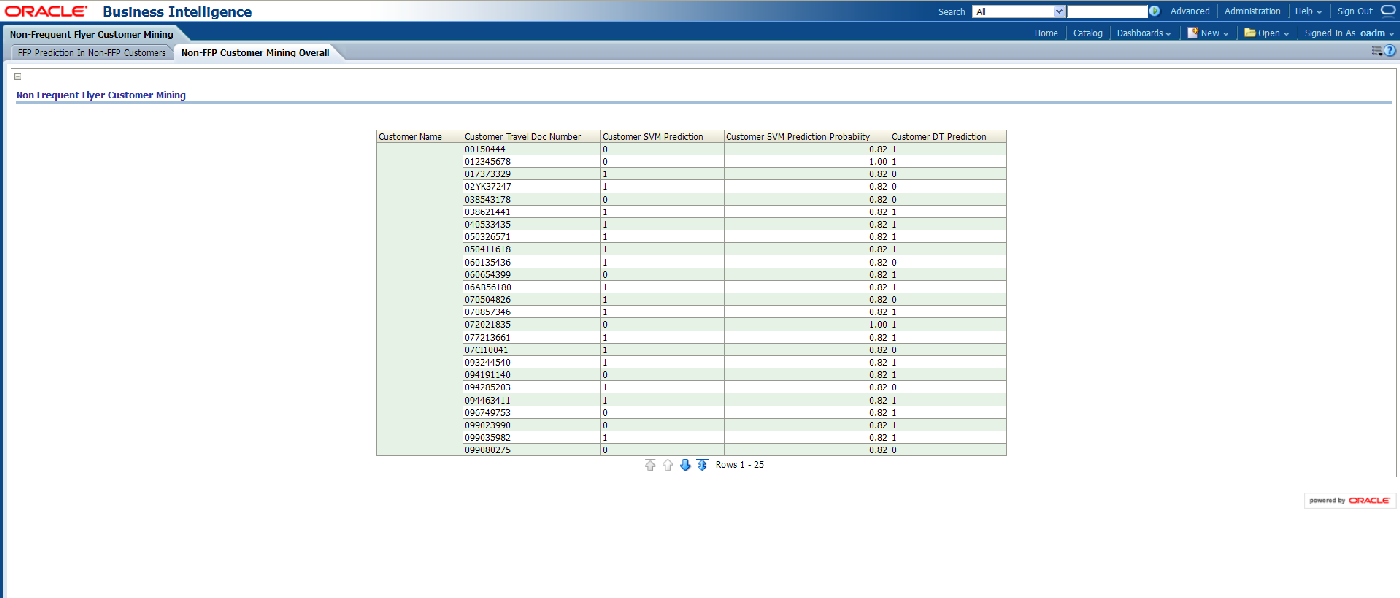
This report, as shown in Figure 11-39 provides the Non-FFP Customer Mining Overall Sample Report.
Figure 11-39 Non-FFP Customer Mining Overall Sample Report
This Customer Interaction Analysis reports include the following areas:
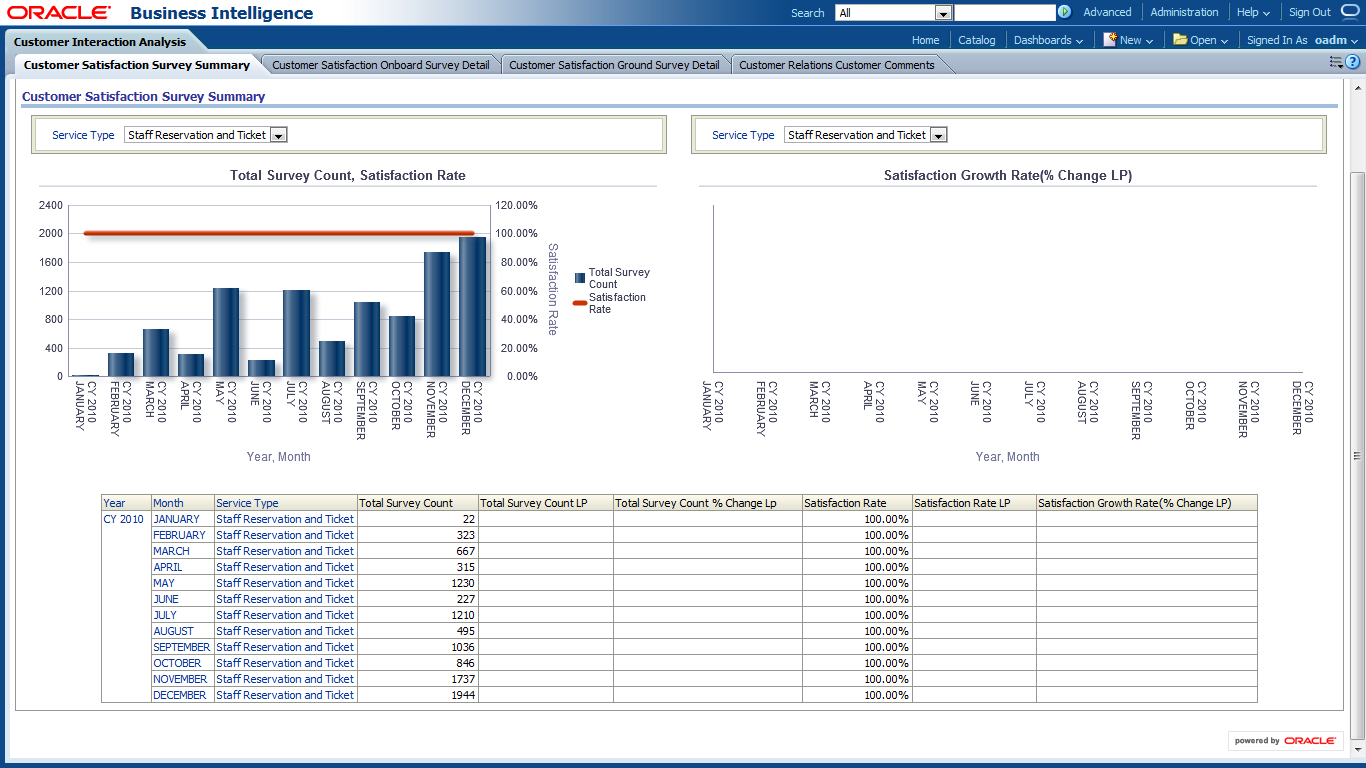
This report, as shown in Figure 11-40 provides the yearly month wise customer satisfaction survey summary based on service type, that is, count of surveys made, satisfaction rate of customers known through the survey is known in this report. The report shows metrics such as LP, % Change LP for the total survey count and satisfaction rate of the customers.
Report dimensions are:
Time
Service Type
Figure 11-40 Customer Satisfaction Survey Summary Sample Report
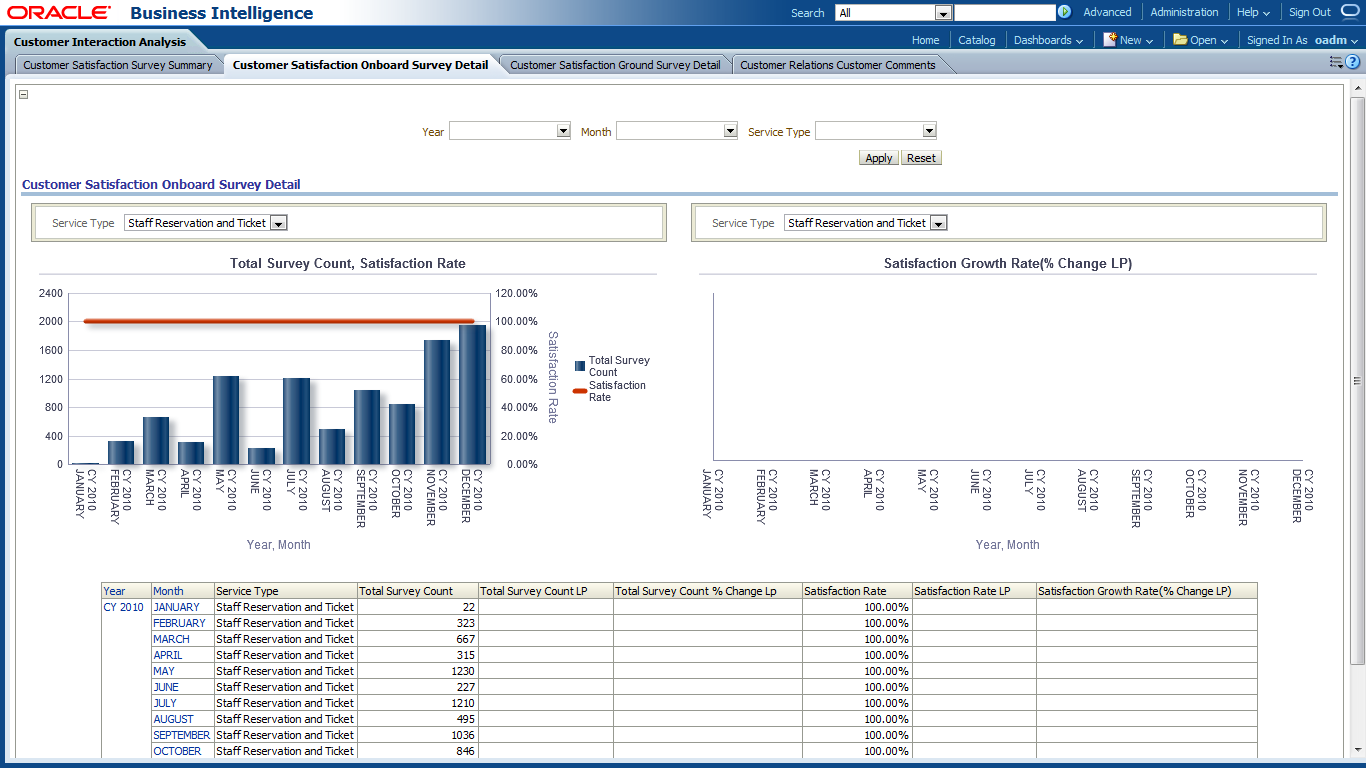
This report, as shown in Figure 11-41 provides the current year month level customer satisfaction onboard based on service type. The report includes information on the total surveys and the satisfaction rate of the customers onboard. The report shows metrics such as LP, % Change LP for total survey count and satisfaction rate.
Report dimensions are:
Time
Service Type
Figure 11-41 Customer Satisfaction Onboard Survey Detail Sample Report
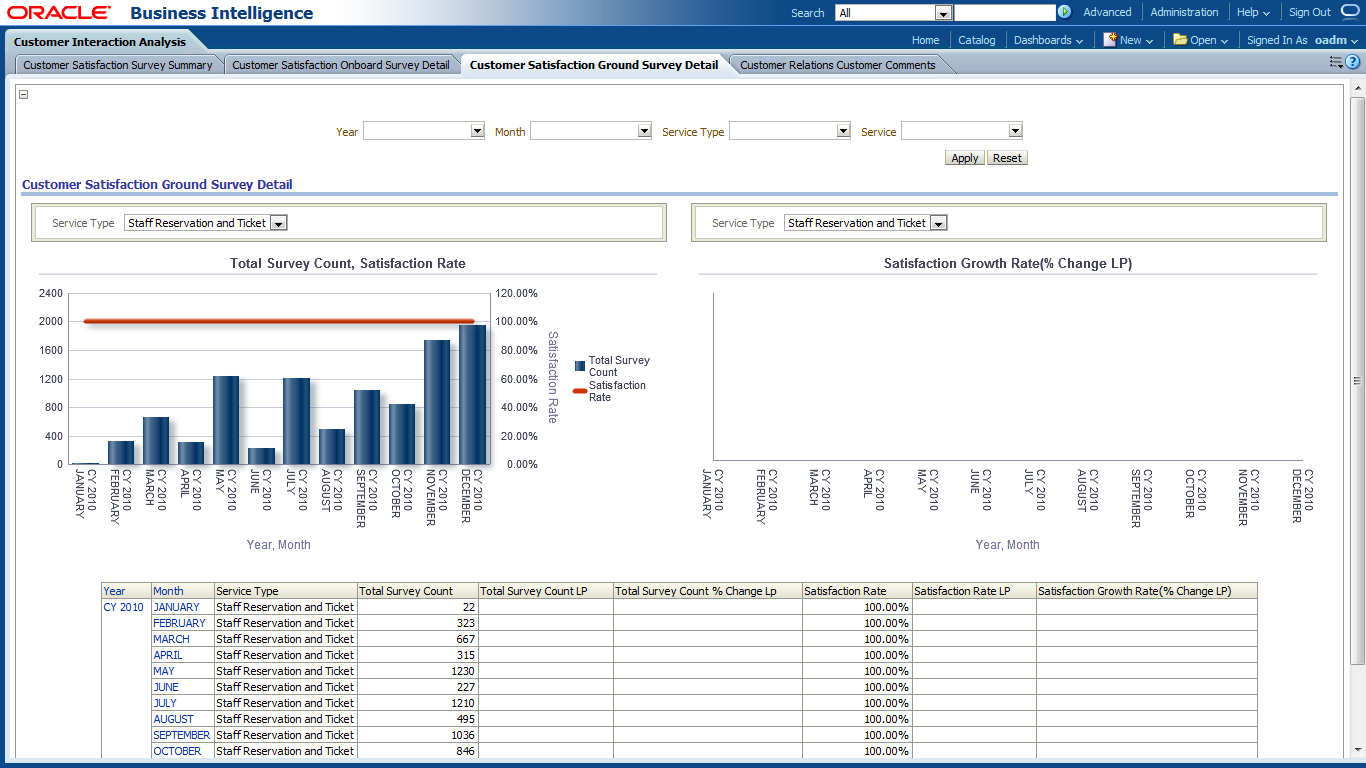
This report, as shown in Figure 11-42 provides the customer satisfaction ground survey details for current year month wise. Statistics on Total surveys made, what is the satisfaction rate of the customers will be provided along with LP and % Change LP in this report.
Report dimensions are:
Time
Service Type
Figure 11-42 Customer Satisfaction Ground Survey Detail Sample Report
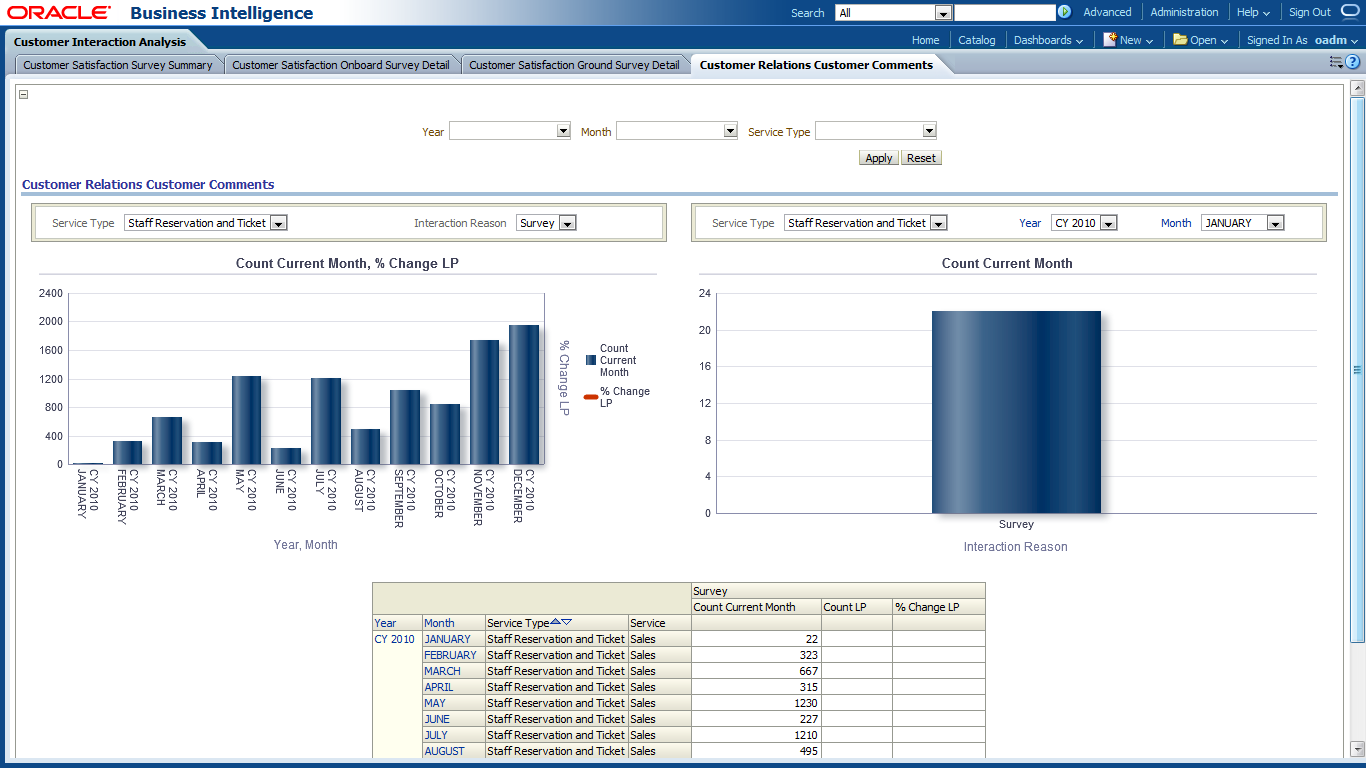
This report, as shown in Figure 11-43 provides the month level customer relations. The report includes statistics on count of surveys made in the current month for the service type and service. The metrics like LP and % Change LP will also be there for this.
Report dimensions are:
Time
Service Type
Figure 11-43 Customer Relations Customer Comments Sample Report
|
Copyright © 2010, 2011, Oracle and/or its affiliates. All rights reserved. Legal Notices |
|