9.7 Reviewing Performance Metrics
You can view a variety of performance metrics for the Oracle Database QoS Management system as a whole, or for individual Performance Classes.
- Viewing Performance Metrics for All Performance Classes
You can view the performance metrics for your system on the Performance Class Quality of Service page. - Viewing Performance Metrics for Individual Performance Classes
After you have configured Oracle Database Quality of Service Management, and a short period of time has passed, you can view the performance metrics for a specific Performance Class. - Configuring Alerts for Quality of Service Management Events
It is not convenient or efficient to require constant manual monitoring of the Quality of Service Management Dashboard. Instead you can use the Enterprise Manager Cloud Control notification system for reporting negative Performance Satisfaction Metrics (PSMs) that persist for user-specified times. - Viewing the Resource Wait Times Breakdown
Parent topic: Administering the Oracle Database QoS Management System
9.7.1 Viewing Performance Metrics for All Performance Classes
You can view the performance metrics for your system on the Performance Class Quality of Service page.
After you have configured Oracle Database QoS Management, a short period of time is required for Oracle Database QoS Management to gather performance data and evaluate the performance of the system. After this period of time has passed, you can view the performance metrics for your system. To view the current performance metrics, perform the following steps:
-
Log in to Oracle Enterprise Manager Cloud Control as the cluster administrator. Go to the cluster target page.
-
From the cluster target menu, select Administration, then Quality of Service Management, then View Performance Class Quality of Service.
-
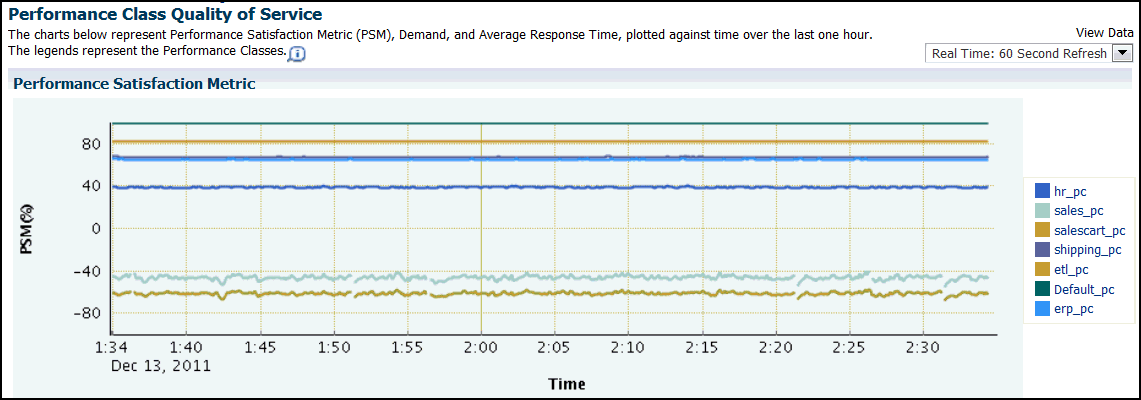
The Performance Class Quality of Service page displays three charts measuring the current performance of each Performance Class that is being monitored:
-
The Performance Satisfaction Metric chart
-
The Demand chart
-
The Average Response Time chart
-
Parent topic: Reviewing Performance Metrics
9.7.2 Viewing Performance Metrics for Individual Performance Classes
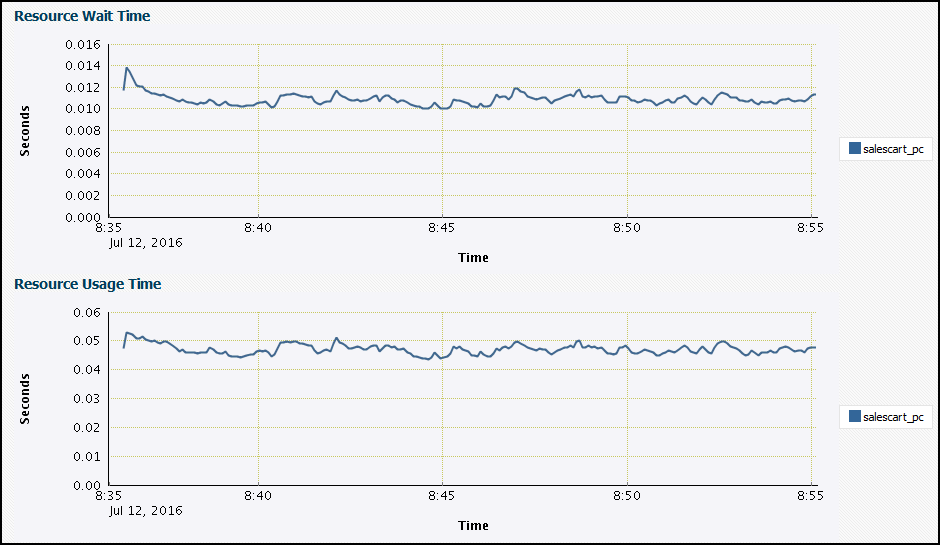
After you have configured Oracle Database Quality of Service Management, and a short period of time has passed, you can view the performance metrics for a specific Performance Class.
To view the current performance metrics for a Performance Class, perform the following steps:
Parent topic: Reviewing Performance Metrics
9.7.3 Configuring Alerts for Quality of Service Management Events
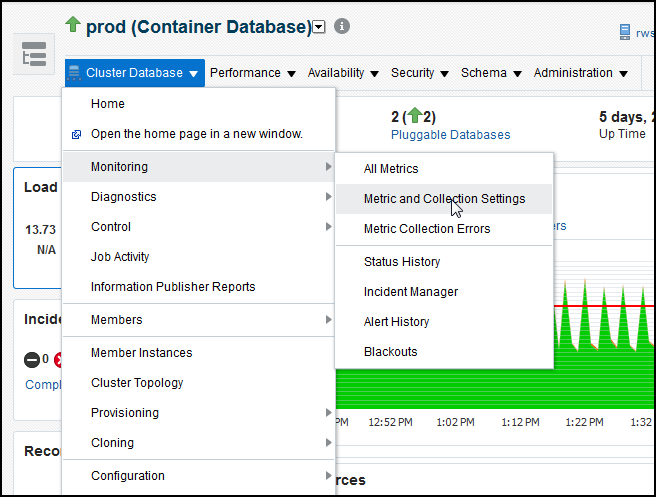
It is not convenient or efficient to require constant manual monitoring of the Quality of Service Management Dashboard. Instead you can use the Enterprise Manager Cloud Control notification system for reporting negative Performance Satisfaction Metrics (PSMs) that persist for user-specified times.
Parent topic: Reviewing Performance Metrics
9.7.4 Viewing the Resource Wait Times Breakdown
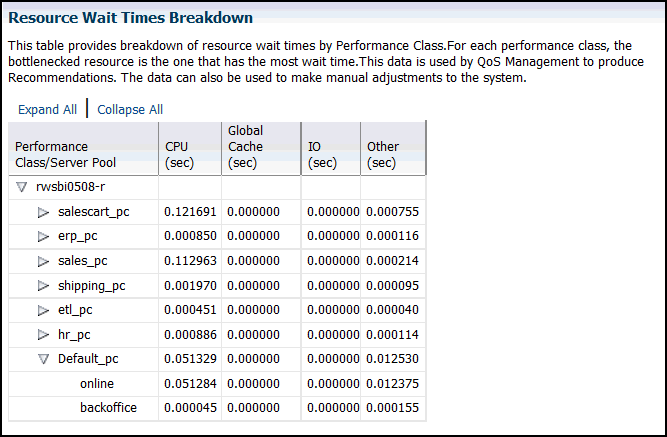
At the bottom of the Dashboard is the Resource Wait Times Breakdown table. This table provides breakdown of resource wait times by Performance Class. For each Performance Class, the bottlenecked resource is the one that has the most wait time. This data is used by Oracle Database QoS Management to produce recommendations. You can also use this data to make manual adjustments to your system.
Parent topic: Reviewing Performance Metrics


