

(Source code, png, pdf)
import matplotlib.pyplot as plt
from mpl_toolkits.axes_grid1 import ImageGrid
def get_demo_image():
import numpy as np
from matplotlib.cbook import get_sample_data
f = get_sample_data("axes_grid/bivariate_normal.npy", asfileobj=False)
z = np.load(f)
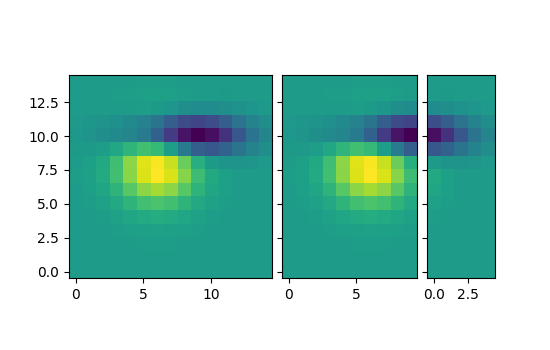
# z is a numpy array of 15x15
return z, (-3, 4, -4, 3)
F = plt.figure(1, (5.5, 3.5))
grid = ImageGrid(F, 111, # similar to subplot(111)
nrows_ncols=(1, 3),
axes_pad=0.1,
add_all=True,
label_mode="L",
)
Z, extent = get_demo_image() # demo image
im1 = Z
im2 = Z[:, :10]
im3 = Z[:, 10:]
vmin, vmax = Z.min(), Z.max()
for i, im in enumerate([im1, im2, im3]):
ax = grid[i]
ax.imshow(im, origin="lower", vmin=vmin,
vmax=vmax, interpolation="nearest")
plt.draw()
plt.show()
Keywords: python, matplotlib, pylab, example, codex (see Search examples)