

(Source code, png, pdf)
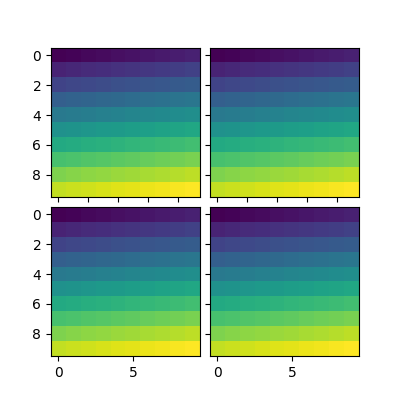
import matplotlib.pyplot as plt
from mpl_toolkits.axes_grid1 import ImageGrid
import numpy as np

im = np.arange(100)
im.shape = 10, 10

fig = plt.figure(1, (4., 4.))
grid = ImageGrid(fig, 111,  # similar to subplot(111)
                 nrows_ncols=(2, 2),  # creates 2x2 grid of axes
                 axes_pad=0.1,  # pad between axes in inch.
                 )

for i in range(4):
    grid[i].imshow(im)  # The AxesGrid object work as a list of axes.

plt.show()
Keywords: python, matplotlib, pylab, example, codex (see Search examples)