Getting Started with VisualVM
Note: this page is also available in Japanese  ,
Simplified Chinese
  and
Korean
  .
.
VisualVM provides detailed information about Java applications while they are running on the Java Virutal Machine (JVM). VisualVM's graphical user interface enables you to quickly and easily see information about multiple Java applications.
This getting started guide should help you quickly get up and running with the VisualVM. This guide will demonstrate how to install VisualVM and add functionality to the tool by installing a plugin from the VisualVM update center. This guide will show you how to launch VisualVM and view some of the information you can get about an application running on local and remote JVMs.
VisualVM In Action
See the VisualVM features in this short screencast:
Installing VisualVM
- Download the VisualVM installer from the VisualVM project page.
- Extract the VisualVM installer to an empty directory on your local system.
Starting VisualVM
To start VisualVM on Windows, run the visualvm.exe program that is in the
\bin folder under the VisualVM install folder.
On Unix or Linux use the visualvm shell script that is in the /bin
folder under the VisualVM install folder. You may specify the JDK which runs VisualVM
and/or user directory using command line parameters or by modifying etc\visualvm.conf
file. Example command for starting VisualVM with custom JDK and userdir on Windows is:
visualvm.exe --jdkhome "C:\Software\Java\jdk1.6.0" --userdir "C:\Temp\visualvm_userdir"
Using the Applications Window
The main window of VisualVM opens when you launch the application. By default, the Applications window is displayed in the left pane of the main window. The Applications window enables you to quickly see the Java applications running on a local and remote JVMs.
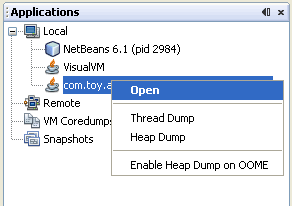
The Applications window is the primary entry point for viewing further details about a particular application. Right-clicking an application node opens the popup menu where you can choose to open the main application tab or take thread or heap dumps.
For more details about how to use the Applications window to view and save data about applications, see the following pages:
Browsing a Heap Dump
VisualVM has a visualizer that enables you to easily browse heap dumps. You can load an existing heap dump or take a snapshot of the heap for local running applications.
To take a heap dump of a local application you can do either of the following:
- Right-click an application's node in the Applications window and choose Heap Dump.
- Double-click the application node in the Applications window to open the application tab and click Heap Dump in the Monitor tab.
To open a saved heap dump, choose File > Load from the main menu and locate the saved heap dump.
To browse an open heap dump:
- Click Classes in the Heap Dump toolbar to view a list of the live classes and corresponding instances.
- Double-click a class name to open the Instances view to view a list of the instances.
- Select an instance from the list to view the references to that instance.
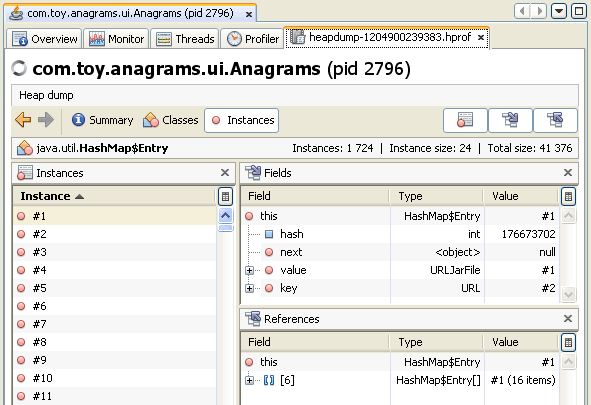
When you take a heap dump, VisualVM opens the heap dump in a new tab and creates a node for the heap dump under the application node in the Applications window. To save the generated heap dump, right-click the heap dump node and choose Save As. If you do not explicitly save the generated heap dump, the dump will be deleted when the application closes.
For more information, see the following document:
Profiling an Application
VisualVM includes a profiler that enables you to profile applications running on a local JVM.
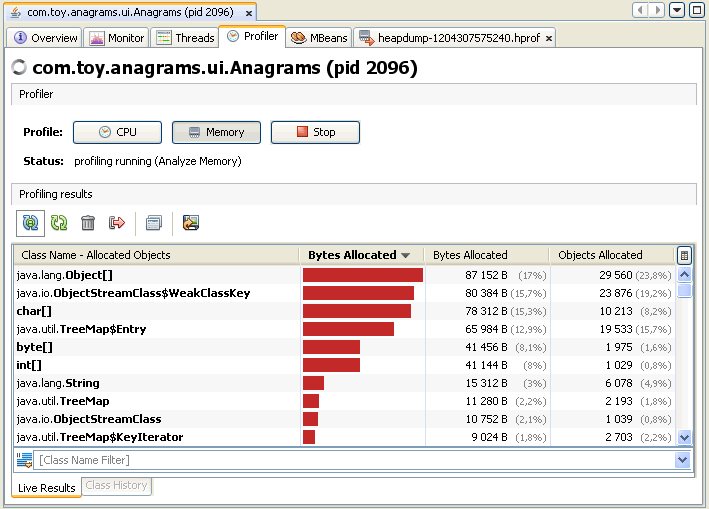
You access the profiling controls in the Profiler tab of the application tab.
The profiler enables you to analyze memory usage and CPU performance of local applications.
Note. To profile an application running on JDK 6, you need to turn off class sharing for the application otherwise the application may crash.
To turn off class sharing, start the application with -Xshare:off argument.
- Launch a local Java application. (Start the application with the -Xshare:off argument.)
- Under the Local node in the Applications window, right-click the application node and choose Open to open the application tab.
- Click the Profiler tab in the application tab.
- Click Memory or CPU in the Profiler tab.
When you choose a profiling task, VisualVM displays the profiling data in the Profiler tab.
For more information about profiling using VisualVM, see the following document:
Connecting to a Remote Host
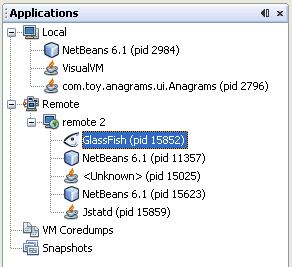
VisualVM enables you to easily monitor applications running on remote hosts and view general data about the remote system. To view information about applications on remote hosts, you must first connect to the remote host. Connected remote hosts are listed below the Remote node in the Applications window. Expand the remote host node to view the applications running on the remote host.
To retrieve data from a remote application, the jstatd utility needs to be running on the remote JVM. For more information on how to start jstatd, see jstatd - Virtual Machine jstat Daemon. You cannot profile applications running on a remote host.
- Right-click Remote in the Applications window and choose Add Remote Host.
- In the Add Remote Host dialog box, type the host name or IP address of the remote machine.
- (Optional) Type a display name for the remote host. This name is displayed in the Applications window. If no display name is entered, the host name is used to identify the remote host in the Applications window.
- Click OK.
When you click OK, a node for the remote host appears under the Remote node. Expand the remote host node to see the Java applications that are running on the remote host.
You can double-click on the name of the remote applications to open the application tab in VisualVM.
For more information, see the following document:
Installing VisualVM Plugins
You can add functionality to VisualVM by installing plugins available from the VisualVM update center. For example, installing the VisualVM-MBeans plugin adds an MBeans tab to the application tab that enables you to monitor and manage MBeans from within VisualVM.
To install a VisualVM plugin:
- Choose Tools > Plugins from the main menu.
- In the Available Plugins tab, select the Install checkbox for the plugin. Click Install.
- Step through and complete the plugin installer.
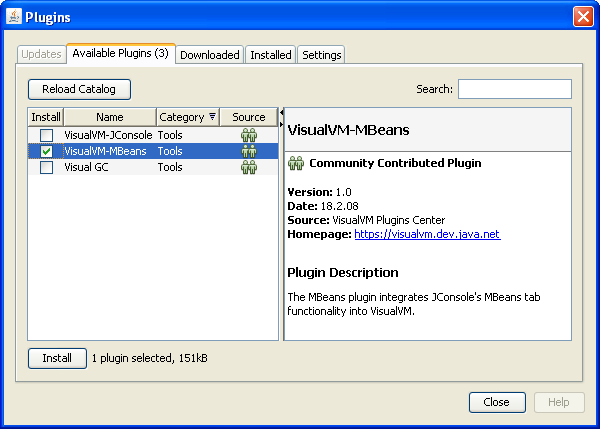
Screenshot of Plugin manager with the VisualVM-MBeans plugin selected.
Additional VisualVM Documentation
This document introduces some of the features of VisualVM. VisualVM is designed to be an intuitive visual interface that enables you to easily explore information about Java applications running on local and remote JVMs. For more detailed information about working with VisualVM features, see the following documents: