The following metrics are arguably the most important to monitor for each RegionServer for "macro monitoring", preferably with a system like OpenTSDB. If your cluster is having performance issues it's likely that you'll see something unusual with this group.
OS:
IO Wait
User CPU
Java:
GC
For more information on HBase metrics, see Section 17.4, “HBase Metrics”.
The HBase slow query log consists of parseable JSON structures describing the properties
of those client operations (Gets, Puts, Deletes, etc.) that either took too long to run, or
produced too much output. The thresholds for "too long to run" and "too much output" are
configurable, as described below. The output is produced inline in the main region server
logs so that it is easy to discover further details from context with other logged events.
It is also prepended with identifying tags (responseTooSlow),
(responseTooLarge), (operationTooSlow), and
(operationTooLarge) in order to enable easy filtering with grep, in
case the user desires to see only slow queries.
There are two configuration knobs that can be used to adjust the thresholds for when queries are logged.
hbase.ipc.warn.response.timeMaximum number of milliseconds that a query can be run without being logged. Defaults to 10000, or 10 seconds. Can be set to -1 to disable logging by time.hbase.ipc.warn.response.sizeMaximum byte size of response that a query can return without being logged. Defaults to 100 megabytes. Can be set to -1 to disable logging by size.
The slow query log exposes to metrics to JMX.
hadoop.regionserver_rpc_slowResponsea global metric reflecting the durations of all responses that triggered logging.hadoop.regionserver_rpc_methodName.aboveOneSecA metric reflecting the durations of all responses that lasted for more than one second.
The output is tagged with operation e.g. (operationTooSlow) if
the call was a client operation, such as a Put, Get, or Delete, which we expose detailed
fingerprint information for. If not, it is tagged (responseTooSlow)
and still produces parseable JSON output, but with less verbose information solely
regarding its duration and size in the RPC itself. TooLarge is
substituted for TooSlow if the response size triggered the logging,
with TooLarge appearing even in the case that both size and duration
triggered logging.
2011-09-08 10:01:25,824 WARN org.apache.hadoop.ipc.HBaseServer: (operationTooSlow): {"tables":{"riley2":{"puts":[{"totalColumns":11,"families":{"actions":[{"timestamp":1315501284459,"qualifier":"0","vlen":9667580},{"timestamp":1315501284459,"qualifier":"1","vlen":10122412},{"timestamp":1315501284459,"qualifier":"2","vlen":11104617},{"timestamp":1315501284459,"qualifier":"3","vlen":13430635}]},"row":"cfcd208495d565ef66e7dff9f98764da:0"}],"families":["actions"]}},"processingtimems":956,"client":"10.47.34.63:33623","starttimems":1315501284456,"queuetimems":0,"totalPuts":1,"class":"HRegionServer","responsesize":0,"method":"multiPut"}
Note that everything inside the "tables" structure is output produced by MultiPut's fingerprint, while the rest of the information is RPC-specific, such as processing time and client IP/port. Other client operations follow the same pattern and the same general structure, with necessary differences due to the nature of the individual operations. In the case that the call is not a client operation, that detailed fingerprint information will be completely absent.
This particular example, for example, would indicate that the likely cause of slowness is simply a very large (on the order of 100MB) multiput, as we can tell by the "vlen," or value length, fields of each put in the multiPut.
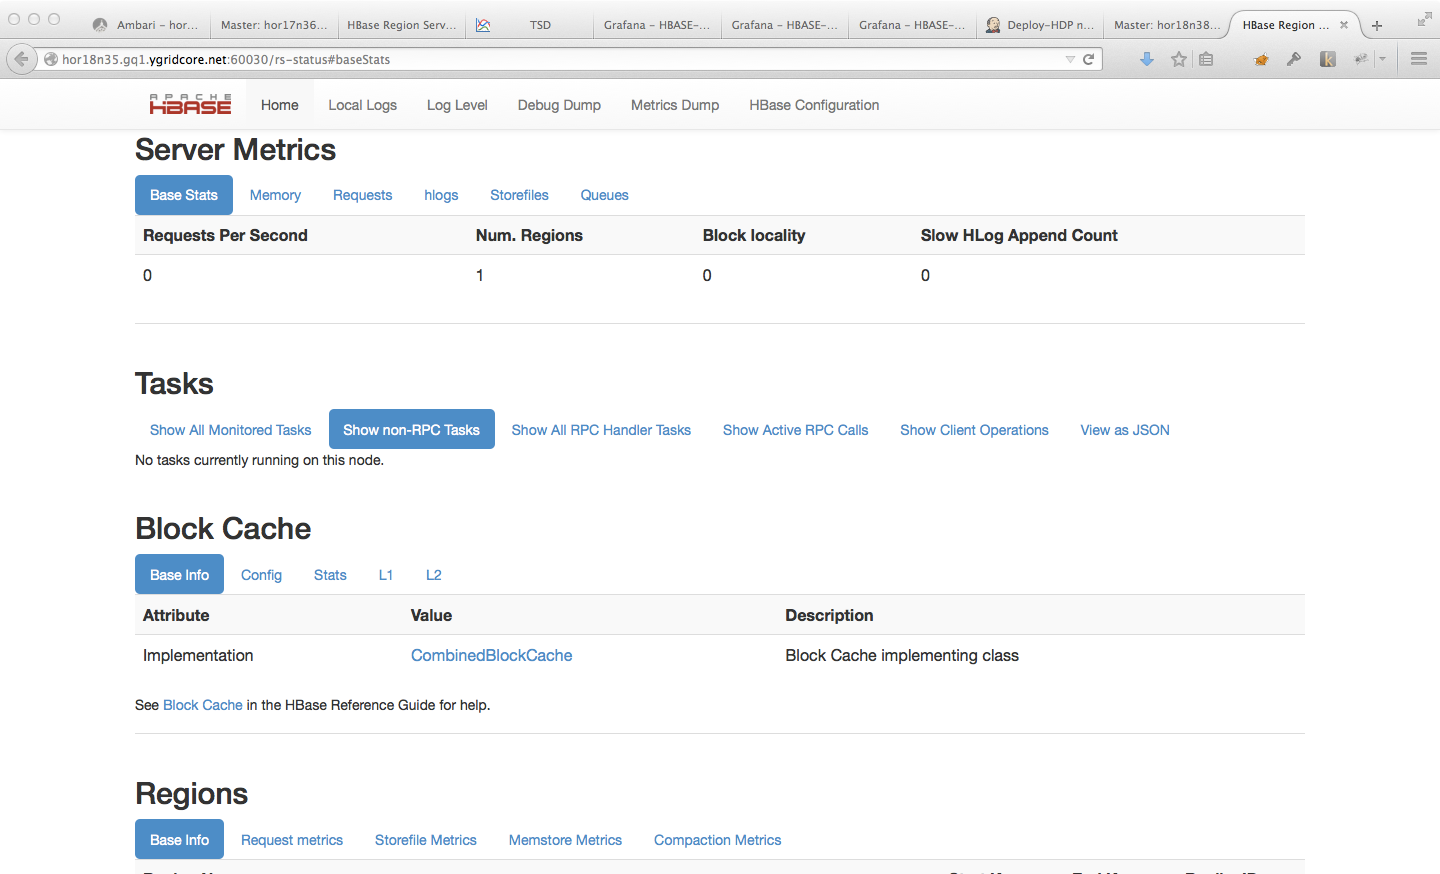
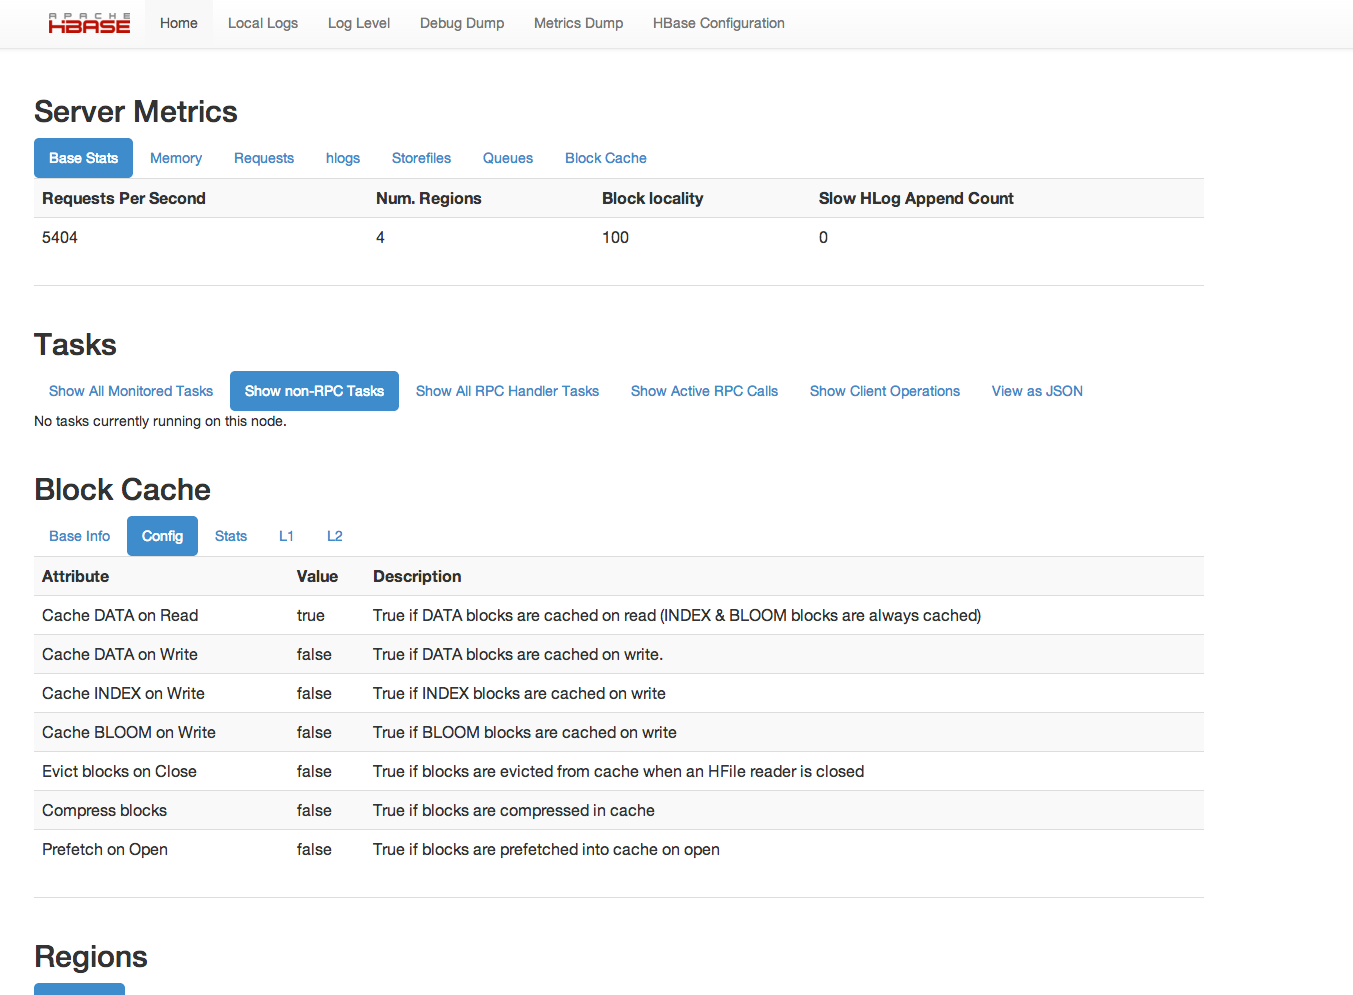
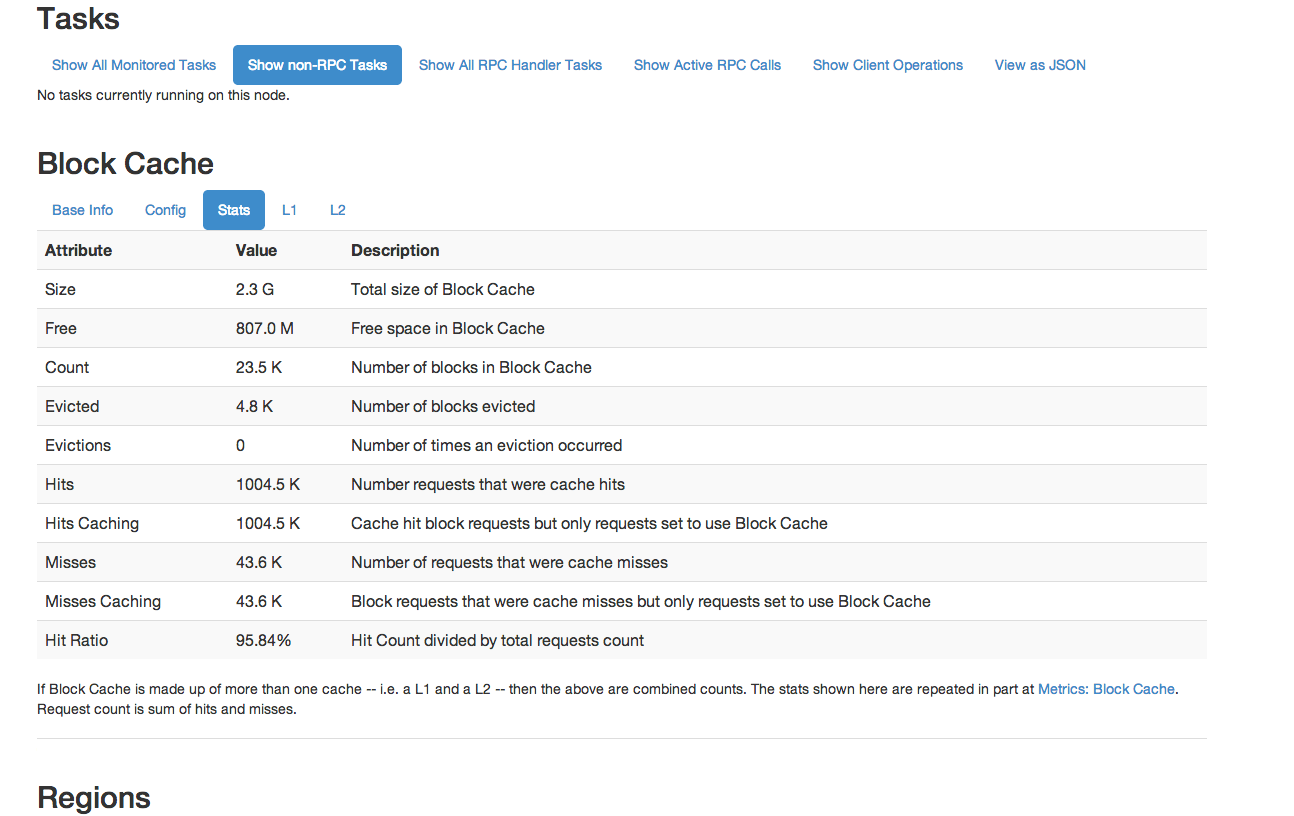
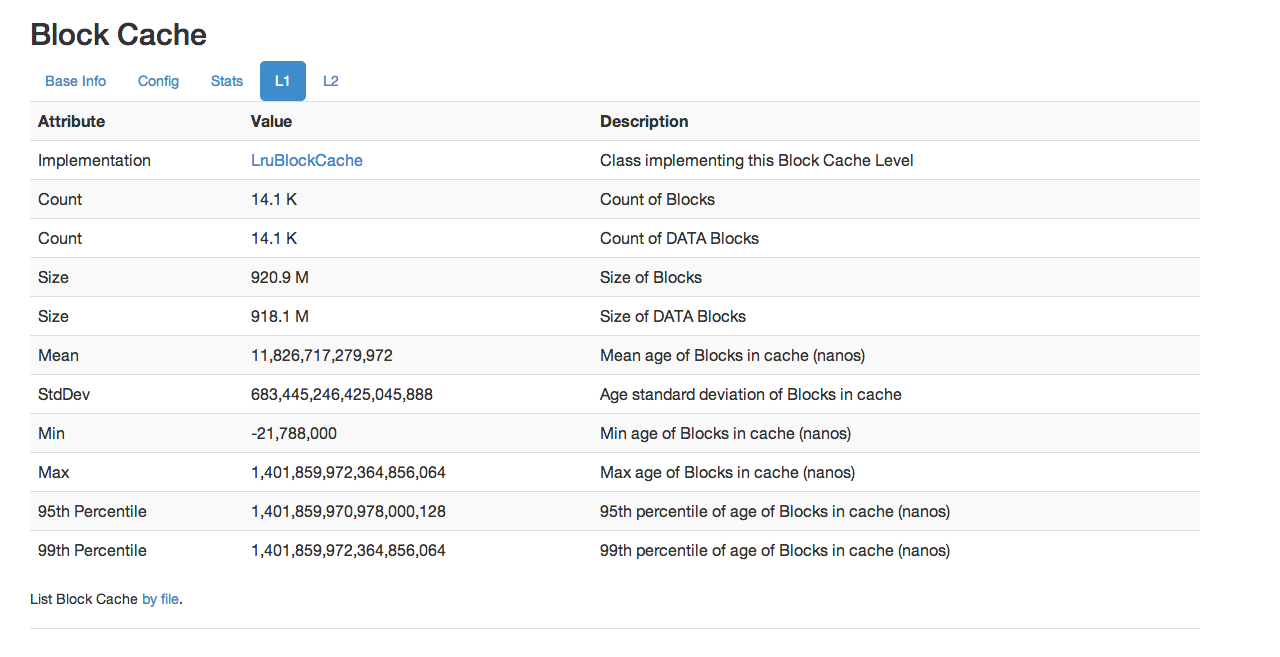
Starting with HBase 0.98, the HBase Web UI includes the ability to monitor and report on the performance of the block cache. To view the block cache reports, click → → . Following are a few examples of the reporting capabilities.
This is not an exhaustive list of all the screens and reports available. Have a look in the Web UI.


