

(Source code, png, pdf)
import matplotlib.pyplot as plt
import numpy as np
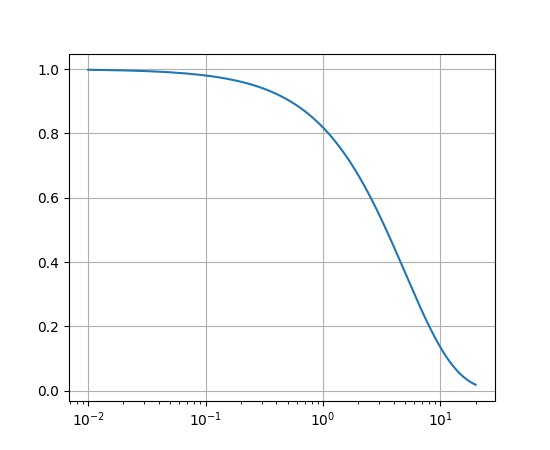
dt = 0.01
t = np.arange(dt, 20.0, dt)
plt.semilogx(t, np.exp(-t/5.0))
plt.grid(True)
plt.show()
Keywords: python, matplotlib, pylab, example, codex (see Search examples)