

(Source code, png, pdf)
import matplotlib
from numpy.random import randn
import matplotlib.pyplot as plt
from matplotlib.ticker import FuncFormatter
def to_percent(y, position):
# Ignore the passed in position. This has the effect of scaling the default
# tick locations.
s = str(100 * y)
# The percent symbol needs escaping in latex
if matplotlib.rcParams['text.usetex'] is True:
return s + r'$\%$'
else:
return s + '%'
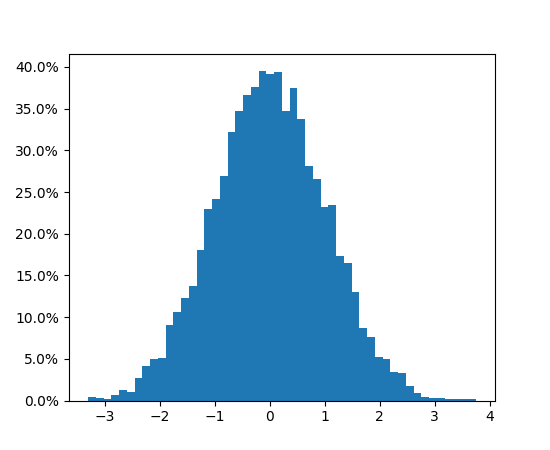
x = randn(5000)
# Make a normed histogram. It'll be multiplied by 100 later.
plt.hist(x, bins=50, normed=True)
# Create the formatter using the function to_percent. This multiplies all the
# default labels by 100, making them all percentages
formatter = FuncFormatter(to_percent)
# Set the formatter
plt.gca().yaxis.set_major_formatter(formatter)
plt.show()
Keywords: python, matplotlib, pylab, example, codex (see Search examples)