

(Source code, png, pdf)
from mpl_toolkits.axes_grid.axislines import SubplotZero
import matplotlib.pyplot as plt
import numpy as np
if 1:
fig = plt.figure(1)
ax = SubplotZero(fig, 111)
fig.add_subplot(ax)
for direction in ["xzero", "yzero"]:
ax.axis[direction].set_axisline_style("-|>")
ax.axis[direction].set_visible(True)
for direction in ["left", "right", "bottom", "top"]:
ax.axis[direction].set_visible(False)
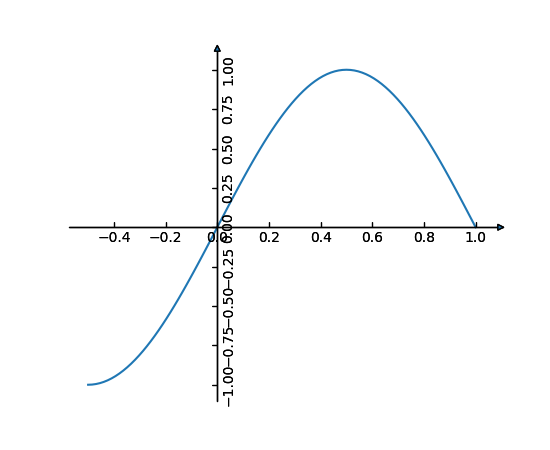
x = np.linspace(-0.5, 1., 100)
ax.plot(x, np.sin(x*np.pi))
plt.show()
Keywords: python, matplotlib, pylab, example, codex (see Search examples)