

(Source code, png, pdf)
"""
==================================
Modifying the coordinate formatter
==================================
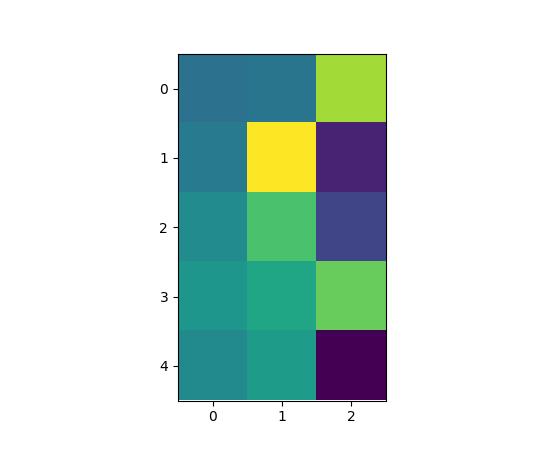
Show how to modify the coordinate formatter to report the image "z"
value of the nearest pixel given x and y
"""
import numpy as np
import matplotlib.pyplot as plt
X = 10*np.random.rand(5, 3)
fig, ax = plt.subplots()
ax.imshow(X, interpolation='nearest')
numrows, numcols = X.shape
def format_coord(x, y):
col = int(x + 0.5)
row = int(y + 0.5)
if col >= 0 and col < numcols and row >= 0 and row < numrows:
z = X[row, col]
return 'x=%1.4f, y=%1.4f, z=%1.4f' % (x, y, z)
else:
return 'x=%1.4f, y=%1.4f' % (x, y)
ax.format_coord = format_coord
plt.show()
Keywords: python, matplotlib, pylab, example, codex (see Search examples)