

Axes.hexbin(x, y, C=None, gridsize=100, bins=None, xscale='linear', yscale='linear', extent=None, cmap=None, norm=None, vmin=None, vmax=None, alpha=None, linewidths=None, edgecolors='none', reduce_C_function=<function mean>, mincnt=None, marginals=False, **kwargs)¶Make a hexagonal binning plot.
Make a hexagonal binning plot of x versus y, where x, y are 1-D sequences of the same length, N. If C is None (the default), this is a histogram of the number of occurences of the observations at (x[i],y[i]).
If C is specified, it specifies values at the coordinate (x[i],y[i]). These values are accumulated for each hexagonal bin and then reduced according to reduce_C_function, which defaults to numpy’s mean function (np.mean). (If C is specified, it must also be a 1-D sequence of the same length as x and y.)
| Parameters: | x, y : array or masked array C : array or masked array, optional, default is None gridsize : int or (int, int), optional, default is 100
bins : {‘log’} or int or sequence, optional, default is None
xscale : {‘linear’, ‘log’}, optional, default is ‘linear’
yscale : {‘linear’, ‘log’}, optional, default is ‘linear’
mincnt : int > 0, optional, default is None
marginals : bool, optional, default is False
extent : scalar, optional, default is None
|
|---|---|
| Returns: | object
|
| Other Parameters: | |
cmap : object, optional, default is None
norm : object, optional, default is None
vmin, vmax : scalar, optional, default is None
alpha : scalar between 0 and 1, optional, default is None
linewidths : scalar, optional, default is None
edgecolors : {‘none’} or mpl color, optional, default is ‘none’
|
|
Notes
The standard descriptions of all the
Collection parameters:
Property Description agg_filterunknown alphafloat or None animated[True | False] antialiasedor antialiasedsBoolean or sequence of booleans arrayunknown axesan Axesinstanceclima length 2 sequence of floats clip_boxa matplotlib.transforms.Bboxinstanceclip_on[True | False] clip_path[ ( Path,Transform) |Patch| None ]cmapa colormap or registered colormap name colormatplotlib color arg or sequence of rgba tuples containsa callable function edgecoloror edgecolorsmatplotlib color spec or sequence of specs facecoloror facecolorsmatplotlib color spec or sequence of specs figurea matplotlib.figure.Figureinstancegidan id string hatch[ ‘/’ | ‘\’ | ‘|’ | ‘-‘ | ‘+’ | ‘x’ | ‘o’ | ‘O’ | ‘.’ | ‘*’ ] labelstring or anything printable with ‘%s’ conversion. linestyleor dashes or linestyles[‘solid’ | ‘dashed’, ‘dashdot’, ‘dotted’ | (offset, on-off-dash-seq) | '-'|'--'|'-.'|':'|'None'|' '|'']linewidthor linewidths or lwfloat or sequence of floats normunknown offset_positionunknown offsetsfloat or sequence of floats path_effectsunknown picker[None|float|boolean|callable] pickradiusunknown rasterized[True | False | None] sketch_paramsunknown snapunknown transformTransforminstanceurla url string urlsunknown visible[True | False] zorderany number
Note
In addition to the above described arguments, this function can take a data keyword argument. If such a data argument is given, the following arguments are replaced by data[<arg>]:
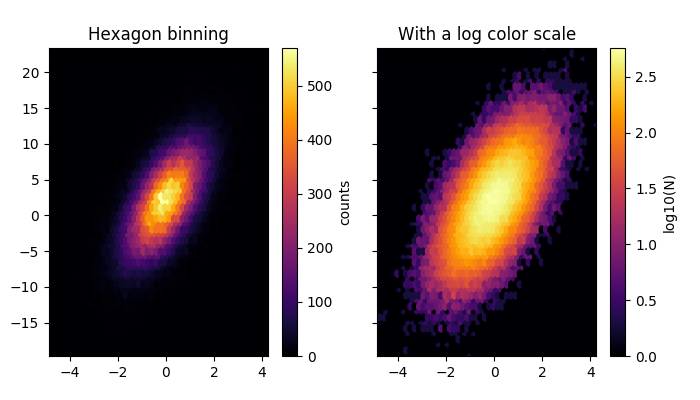
Examples
(Source code, png, pdf)
 is used to
determine the hexagon color.
is used to
determine the hexagon color.