

Axes.bxp(bxpstats, positions=None, widths=None, vert=True, patch_artist=False, shownotches=False, showmeans=False, showcaps=True, showbox=True, showfliers=True, boxprops=None, whiskerprops=None, flierprops=None, medianprops=None, capprops=None, meanprops=None, meanline=False, manage_xticks=True, zorder=None)¶Drawing function for box and whisker plots.
Make a box and whisker plot for each column of x or each vector in sequence x. The box extends from the lower to upper quartile values of the data, with a line at the median. The whiskers extend from the box to show the range of the data. Flier points are those past the end of the whiskers.
| Parameters: | bxpstats : list of dicts
positions : array-like, default = [1, 2, ..., n]
widths : array-like, default = 0.5
vert : bool, default = False
patch_artist : bool, default = False shownotches : bool, default = False
showmeans : bool, default = False
showcaps : bool, default = True
showbox : bool, default = True
showfliers : bool, default = True
boxprops : dict or None (default)
whiskerprops : dict or None (default)
capprops : dict or None (default)
flierprops : dict or None (default)
medianprops : dict or None (default)
meanprops : dict or None (default)
meanline : bool, default = False
manage_xticks : bool, default = True
zorder : scalar, default = None
|
|---|---|
| Returns: | result : dict
|
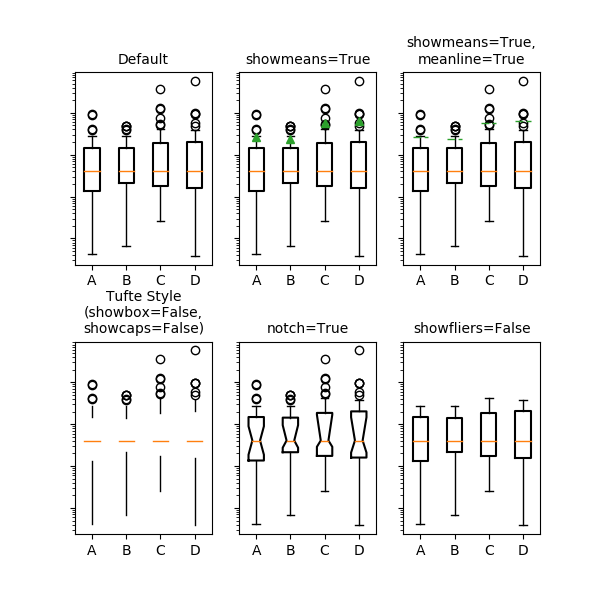
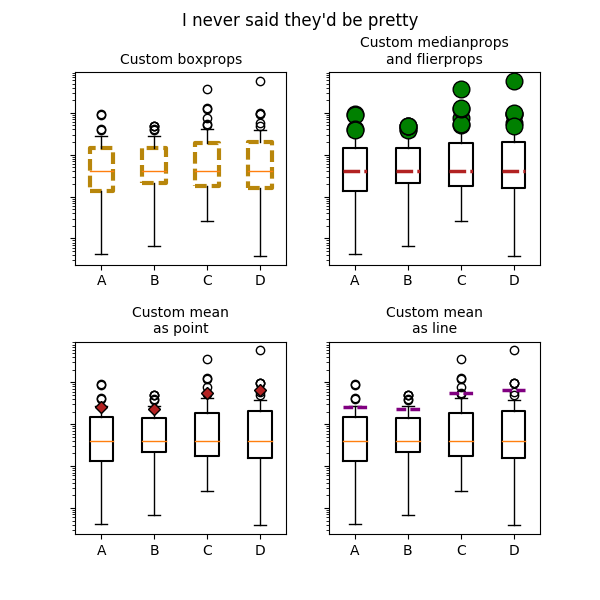
Examples
(Source code, png, pdf)