Working with Local Applications
When you start VisualVM, a node for each local Java application is displayed under the Local node in the Applications window.
You can expand an application node to see the profiler snapshots, thread dumps and heap dumps of the application.
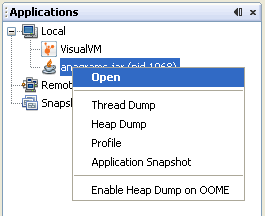
Right-clicking an application node or sub-node invokes a popup menu enabling you to choose various actions.
Note: The list of local applications always includes VisualVM.

A local application node generally has the following items available in the popup menu.
- Open. Opens the tab for the application in the main window where you can view application data.
- Thread Dump. Takes a thread dump for the application.
- Heap Dump. Takes a heap dump for the application.
- Profile. Opens the Profiler sub-tab for the application where you can choose to profile the application. (Note that even though VisualVM appears in the application tree, VisualVM cannot profile itself).
- Profiler Snapshot. Creates a snapshot of the results from the profiling session. The snapshot opens in the main window and a node for the snapshot appears under the application node. This command is only available when VisualVM is profiling the application.
- Application Snapshot. Creates an application snapshot containing all application dumps and snapshots. A node for the application snapshot appears under the Snapshots node.
- Enable Heap Dump on OOME. Select this if you want VisualVM to automatically take a heap dump when the application encounters an OutOfMemoryException.
You can perform the following tasks directly from the popup menu.
View Application Data
VisualVM displays data about each running local application in a dedicated tab in the main window. Each application tab has sub-tabs where information about that application is displayed.
To open the application tab, right-click the application node in the Applications window and choose Open. (Alternatively, double-click the application node.) When you click Open, the Overview tab of the application tab opens in the main window.
The application tab for a local application has the following sub-tabs:
- Overview. For more, see Viewing Application Overview
- Monitor. For more, see Monitoring an Application
- Threads. For more, see Monitoring Application Threads
- Profiler. For more, see Profiling Applications
Additional tabs and sub-tabs may be visible depending on the installed plugins.
Take a Thread Dump
You can use VisualVM to take a thread dump to capture information about the active application threads at the time you take the thread dump. When you take a thread dump, the thread dump opens in a sub-tab of the application in the main window. A node for the thread dump appears under the application node in the Applications window.
You can take a thread dump in the following ways:
- Right-click the application node in the Applications window and choose Thread Dump.
- Click the Thread Dump button in the Threads tab of the application tab.
When you take a thread dump, the thread dump opens in a sub-tab of the application in the main window. A node for the thread dump appears under the application node.
For more about working with application threads, see the following document:
Take a Heap Dump
You can take a heap dump of a local application to capture a snapshot of the objects on the heap.
You can take a heap dump in the following ways:
- Right-click the application node in the Applications window and choose Heap Dump.
- Click the Heap Dump button in the Monitor tab of the application tab.
When you take a heap dump, the heap dump opens in a sub-tab of the application in the main window. A node for the heap dump appears under the application node.
For more about working with the heap, see the following document:
Profile an Application
VisualVM includes a profiler that enables you to analyze the performance and memory usage of a local application.
You can profile an application without restarting it. To start a profiling session,
right-click the application node and choosing Profile from the popup menu to open the profiling tab.
Note: VisualVM cannot be used to Profile itself.
For more see the following document:
Take Snapshots
VisualVM enables you to take snapshots that capture application data at the time the snapshot is taken. You can save snapshots to your local system and then examine them later or send them to others.
VisualVM enables you to take the following types of snapshots:
- Profiler snapshots. A profiler snapshot captures the profiling data at the moment the snapshot is takes. The snapshot is either a memory snapshot or a CPU snapshot. You can take a profiler snapshot only when you are profiling an application.
- Application snapshots. An application snapshot is an archive that contains all the heap dumps, thread dumps and snapshots that are listed below the application node.
For more see the following document: