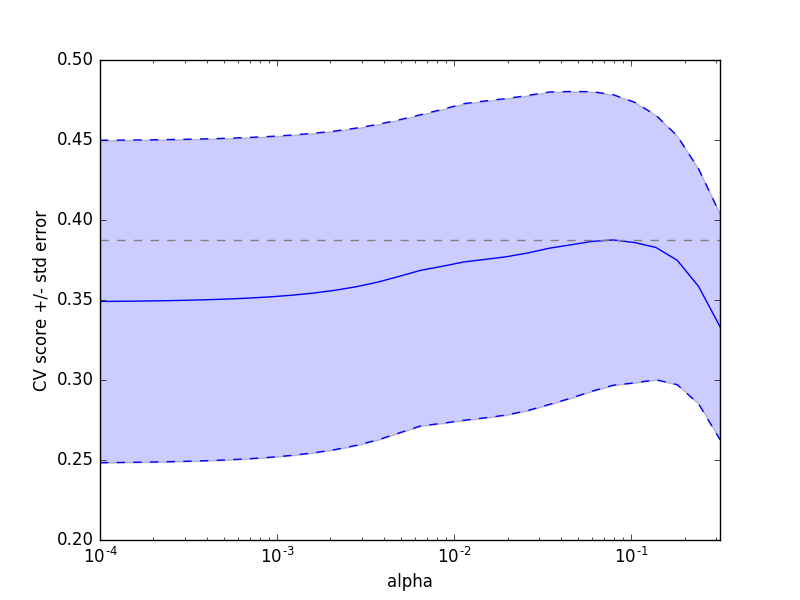
Cross-validation on diabetes Dataset Exercise
A tutorial exercise which uses cross-validation with linear models.
This exercise is used in the Cross-validated estimators part of the Model selection: choosing estimators and their parameters section of the A tutorial on statistical-learning for scientific data processing.
from __future__ import print_function
print(__doc__)

import numpy as np
import matplotlib.pyplot as plt

from sklearn import datasets
from sklearn.linear_model import LassoCV
from sklearn.linear_model import Lasso
from sklearn.model_selection import KFold
from sklearn.model_selection import cross_val_score

diabetes = datasets.load_diabetes()
X = diabetes.data[:150]
y = diabetes.target[:150]

lasso = Lasso(random_state=0)
alphas = np.logspace(-4, -0.5, 30)

scores = list()
scores_std = list()

n_folds = 3

for alpha in alphas:
    lasso.alpha = alpha
    this_scores = cross_val_score(lasso, X, y, cv=n_folds, n_jobs=1)
    scores.append(np.mean(this_scores))
    scores_std.append(np.std(this_scores))

scores, scores_std = np.array(scores), np.array(scores_std)

plt.figure().set_size_inches(8, 6)
plt.semilogx(alphas, scores)

# plot error lines showing +/- std. errors of the scores
std_error = scores_std / np.sqrt(n_folds)

plt.semilogx(alphas, scores + std_error, 'b--')
plt.semilogx(alphas, scores - std_error, 'b--')

# alpha=0.2 controls the translucency of the fill color
plt.fill_between(alphas, scores + std_error, scores - std_error, alpha=0.2)

plt.ylabel('CV score +/- std error')
plt.xlabel('alpha')
plt.axhline(np.max(scores), linestyle='--', color='.5')
plt.xlim([alphas[0], alphas[-1]])

Bonus: how much can you trust the selection of alpha?
# To answer this question we use the LassoCV object that sets its alpha
# parameter automatically from the data by internal cross-validation (i.e. it
# performs cross-validation on the training data it receives).
# We use external cross-validation to see how much the automatically obtained
# alphas differ across different cross-validation folds.
lasso_cv = LassoCV(alphas=alphas, random_state=0)
k_fold = KFold(3)

print("Answer to the bonus question:",
      "how much can you trust the selection of alpha?")
print()
print("Alpha parameters maximising the generalization score on different")
print("subsets of the data:")
for k, (train, test) in enumerate(k_fold.split(X, y)):
    lasso_cv.fit(X[train], y[train])
    print("[fold {0}] alpha: {1:.5f}, score: {2:.5f}".
          format(k, lasso_cv.alpha_, lasso_cv.score(X[test], y[test])))
print()
print("Answer: Not very much since we obtained different alphas for different")
print("subsets of the data and moreover, the scores for these alphas differ")
print("quite substantially.")

plt.show()
Out:
  Answer to the bonus question: how much can you trust the selection of alpha?

Alpha parameters maximising the generalization score on different
subsets of the data:
[fold 0] alpha: 0.10405, score: 0.53573
[fold 1] alpha: 0.05968, score: 0.16278
[fold 2] alpha: 0.10405, score: 0.44437

Answer: Not very much since we obtained different alphas for different
subsets of the data and moreover, the scores for these alphas differ
quite substantially.
Total running time of the script: (0 minutes 0.453 seconds)
Download Python source code:
plot_cv_diabetes.py
Download IPython notebook:
plot_cv_diabetes.ipynb
