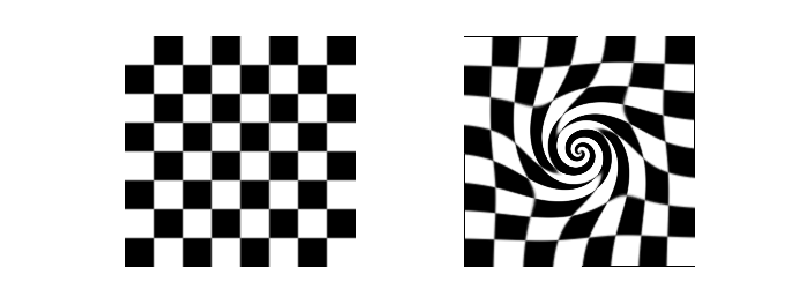
Image swirling is a non-linear image deformation that creates a whirlpool
effect. This example describes the implementation of this transform in
skimage, as well as the underlying warp mechanism.
When applying a geometric transformation on an image, we typically make use of a reverse mapping, i.e., for each pixel in the output image, we compute its corresponding position in the input. The reason is that, if we were to do it the other way around (map each input pixel to its new output position), some pixels in the output may be left empty. On the other hand, each output coordinate has exactly one corresponding location in (or outside) the input image, and even if that position is non-integer, we may use interpolation to compute the corresponding image value.
To perform a geometric warp in skimage, you simply need to provide the
reverse mapping to the skimage.transform.warp() function. E.g., consider
the case where we would like to shift an image 50 pixels to the left. The reverse
mapping for such a shift would be:
def shift_left(xy):
    xy[:, 0] += 50
    return xy
The corresponding call to warp is:
from skimage.transform import warp
warp(image, shift_left)
Consider the coordinate (x, y) in the output image. The reverse mapping for the swirl transformation first computes, relative to a center (x_0, y_0), its polar coordinates,
\theta = \arctan(y/x) \rho = \sqrt{(x - x_0)^2 + (y - y_0)^2},
and then transforms them according to
r = \ln(2) \, \mathtt{radius} / 5 \phi = \mathtt{rotation} s = \mathtt{strength} \theta' = \phi + s \, e^{-\rho / r + \theta}
where strength is a parameter for the amount of swirl, radius indicates
the swirl extent in pixels, and rotation adds a rotation angle. The
transformation of radius into r is to ensure that the
transformation decays to \approx 1/1000^{\mathsf{th}} within the
specified radius.
import matplotlib.pyplot as plt

from skimage import data
from skimage.transform import swirl


image = data.checkerboard()
swirled = swirl(image, rotation=0, strength=10, radius=120)

fig, (ax0, ax1) = plt.subplots(nrows=1, ncols=2, figsize=(8, 3),
                               sharex=True, sharey=True,
                               subplot_kw={'adjustable':'box-forced'})

ax0.imshow(image, cmap=plt.cm.gray, interpolation='none')
ax0.axis('off')
ax1.imshow(swirled, cmap=plt.cm.gray, interpolation='none')
ax1.axis('off')

plt.show()
Total running time of the script: ( 0 minutes 0.090 seconds)
 Source