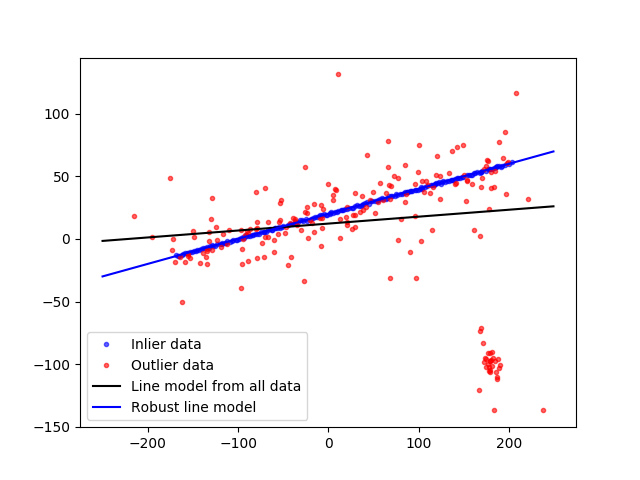
In this example we see how to robustly fit a line model to faulty data using the RANSAC algorithm.
import numpy as np
from matplotlib import pyplot as plt

from skimage.measure import LineModelND, ransac


np.random.seed(seed=1)

# generate coordinates of line
x = np.arange(-200, 200)
y = 0.2 * x + 20
data = np.column_stack([x, y])

# add faulty data
faulty = np.array(30 * [(180., -100)])
faulty += 5 * np.random.normal(size=faulty.shape)
data[:faulty.shape[0]] = faulty

# add gaussian noise to coordinates
noise = np.random.normal(size=data.shape)
data += 0.5 * noise
data[::2] += 5 * noise[::2]
data[::4] += 20 * noise[::4]

# fit line using all data
model = LineModelND()
model.estimate(data)

# robustly fit line only using inlier data with RANSAC algorithm
model_robust, inliers = ransac(data, LineModelND, min_samples=2,
                               residual_threshold=1, max_trials=1000)
outliers = inliers == False

# generate coordinates of estimated models
line_x = np.arange(-250, 250)
line_y = model.predict_y(line_x)
line_y_robust = model_robust.predict_y(line_x)

fig, ax = plt.subplots()
ax.plot(data[inliers, 0], data[inliers, 1], '.b', alpha=0.6,
        label='Inlier data')
ax.plot(data[outliers, 0], data[outliers, 1], '.r', alpha=0.6,
        label='Outlier data')
ax.plot(line_x, line_y, '-k', label='Line model from all data')
ax.plot(line_x, line_y_robust, '-b', label='Robust line model')
ax.legend(loc='lower left')
plt.show()
Total running time of the script: ( 0 minutes 0.183 seconds)
 Source