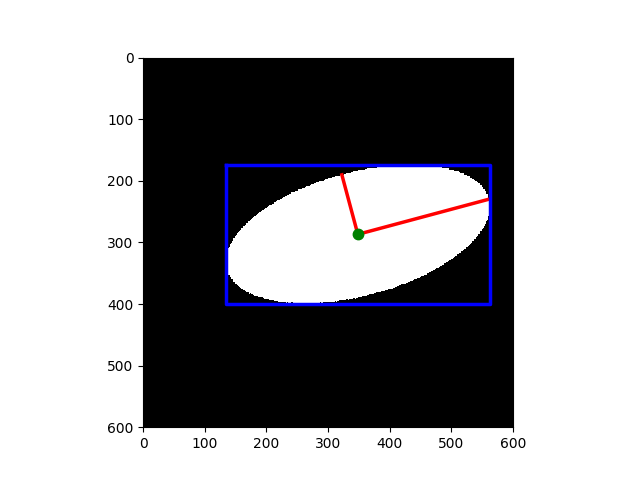
This example shows how to measure properties of labelled image regions.
import math
import matplotlib.pyplot as plt
import numpy as np

from skimage.draw import ellipse
from skimage.measure import label, regionprops
from skimage.transform import rotate


image = np.zeros((600, 600))

rr, cc = ellipse(300, 350, 100, 220)
image[rr, cc] = 1

image = rotate(image, angle=15, order=0)

label_img = label(image)
regions = regionprops(label_img)

fig, ax = plt.subplots()
ax.imshow(image, cmap=plt.cm.gray)

for props in regions:
    y0, x0 = props.centroid
    orientation = props.orientation
    x1 = x0 + math.cos(orientation) * 0.5 * props.major_axis_length
    y1 = y0 - math.sin(orientation) * 0.5 * props.major_axis_length
    x2 = x0 - math.sin(orientation) * 0.5 * props.minor_axis_length
    y2 = y0 - math.cos(orientation) * 0.5 * props.minor_axis_length

    ax.plot((x0, x1), (y0, y1), '-r', linewidth=2.5)
    ax.plot((x0, x2), (y0, y2), '-r', linewidth=2.5)
    ax.plot(x0, y0, '.g', markersize=15)

    minr, minc, maxr, maxc = props.bbox
    bx = (minc, maxc, maxc, minc, minc)
    by = (minr, minr, maxr, maxr, minr)
    ax.plot(bx, by, '-b', linewidth=2.5)

ax.axis((0, 600, 600, 0))
plt.show()
Total running time of the script: ( 0 minutes 0.191 seconds)
 Source