This example constructs a Region Adjacency Graph (RAG) and draws it with the rag_draw method.
from skimage import data, segmentation
from skimage.future import graph
from matplotlib import pyplot as plt
img = data.coffee()
labels = segmentation.slic(img, compactness=30, n_segments=400)
g = graph.rag_mean_color(img, labels)
fig, ax = plt.subplots(nrows=2, sharex=True, sharey=True, figsize=(6, 8))
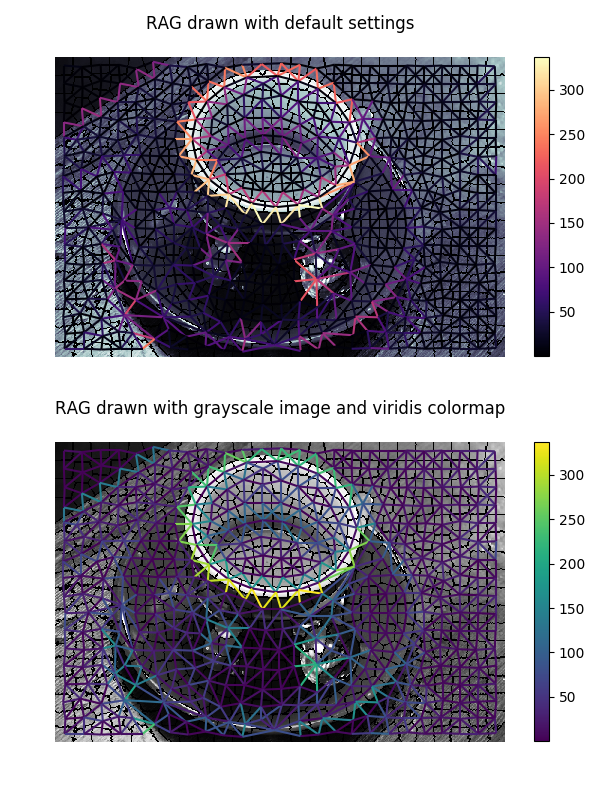
ax[0].set_title('RAG drawn with default settings')
lc = graph.show_rag(labels, g, img, ax=ax[0])
# specify the fraction of the plot area that will be used to draw the colorbar
fig.colorbar(lc, fraction=0.03, ax=ax[0])
ax[1].set_title('RAG drawn with grayscale image and viridis colormap')
lc = graph.show_rag(labels, g, img,
img_cmap='gray', edge_cmap='viridis', ax=ax[1])
fig.colorbar(lc, fraction=0.03, ax=ax[1])
for a in ax:
a.axis('off')
plt.tight_layout()
plt.show()
Total running time of the script: ( 0 minutes 4.497 seconds)
 Source