

axes.prop_cycle key to rcParamsLine2D, Patch and Collectionax.remove() works as expectedclose-figs argument for plot directiveimreadTable of Contents
axes.prop_cycle key to rcParamsclose-figs argument for plot directiveimreadNote
matplotlib 1.5 supports Python 2.7, 3.4, and 3.5
All Artists now keep track of if their internal state has been
changed but not reflected in the display (‘stale’) by a call to
draw. It is thus possible to pragmatically determine if a given
Figure needs to be re-drawn in an interactive session.
To facilitate interactive usage a draw_all method has been added
to pyplot which will redraw all of the figures which are ‘stale’.
To make this convenient for interactive use matplotlib now registers
a function either with IPython’s ‘post_execute’ event or with the
displayhook in the standard python REPL to automatically call
plt.draw_all just before control is returned to the REPL. This ensures
that the draw command is deferred and only called once.
The upshot of this is that for interactive backends (including
%matplotlib notebook) in interactive mode (with plt.ion())
In [1]: import matplotlib.pyplot as plt

In [2]: fig, ax = plt.subplots()

In [3]: ln, = ax.plot([0, 1, 4, 9, 16])

In [4]: plt.show()

In [5]: ln.set_color('g')
will automatically update the plot to be green. Any subsequent
modifications to the Artist objects will do likewise.
This is the first step of a larger consolidation and simplification of the pyplot internals.
Plot methods which take arrays as inputs can now also work with labeled data and unpack such data.
This means that the following two examples produce the same plot:
Example
df = pandas.DataFrame({"var1":[1,2,3,4,5,6], "var2":[1,2,3,4,5,6]})
plt.plot(df["var1"], df["var2"])
Example
plt.plot("var1", "var2", data=df)
This works for most plotting methods, which expect arrays/sequences as
inputs. data can be anything which supports __getitem__
(dict, pandas.DataFrame, h5py, ...) to access array like
values with string keys.
In addition to this, some other changes were made, which makes working with
labeled data (ex pandas.Series) easier:
label keyword argument, one of the
data inputs is designated as the label source. If the user does not
supply a label that value object will be introspected for a
label, currently by looking for a name attribute. If the value
object does not have a name attribute but was specified by as a
key into the data kwarg, then the key is used. In the above
examples, this results in an implicit label="var2" for both
cases.plot() now uses the index of a Series instead of
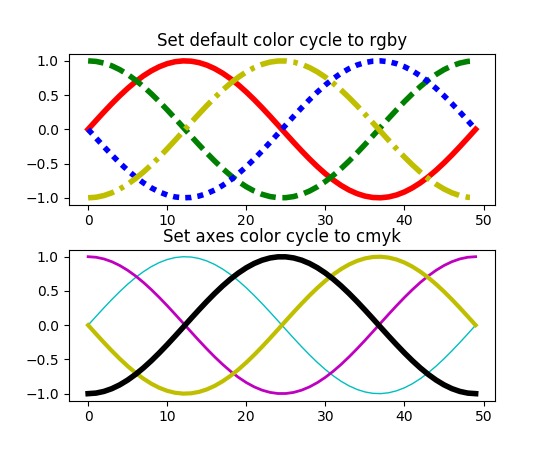
np.arange(len(y)), if no x argument is supplied.axes.prop_cycle key to rcParams¶This is a more generic form of the now-deprecated axes.color_cycle param.
Now, we can cycle more than just colors, but also linestyles, hatches,
and just about any other artist property. Cycler notation is used for
defining property cycles. Adding cyclers together will be like you are
zip()-ing together two or more property cycles together:
axes.prop_cycle: cycler('color', 'rgb') + cycler('lw', [1, 2, 3])
You can even multiply cyclers, which is like using itertools.product()
on two or more property cycles. Remember to use parentheses if writing
a multi-line prop_cycle parameter.
(Source code, png, pdf)

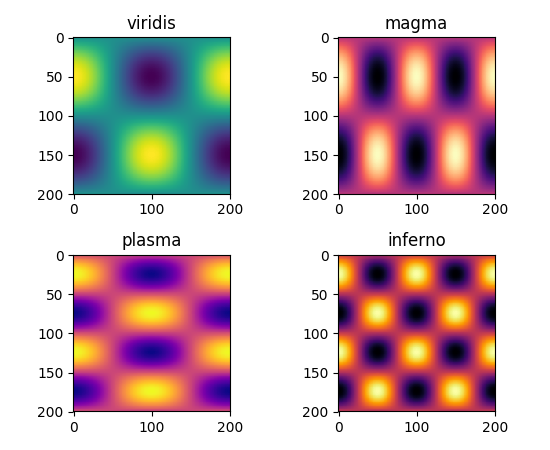
All four of the colormaps proposed as the new default are available
as 'viridis' (the new default in 2.0), 'magma', 'plasma', and
'inferno'
(Source code, png, pdf)
Several new styles have been added, including many styles from the Seaborn project. Additionally, in order to prep for the upcoming 2.0 style-change release, a ‘classic’ and ‘default’ style has been added. For this release, the ‘default’ and ‘classic’ styles are identical. By using them now in your scripts, you can help ensure a smooth transition during future upgrades of matplotlib, so that you can upgrade to the snazzy new defaults when you are ready!
import matplotlib.style
matplotlib.style.use('classic')
The ‘default’ style will give you matplotlib’s latest plotting styles:
matplotlib.style.use('default')
The environment variable MPLBACKEND can now be used to set the
matplotlib backend.
The wx backend can now be used with both wxPython classic and Phoenix.
wxPython classic has to be at least version 2.8.12 and works on Python 2.x. As of May 2015 no official release of wxPython Phoenix is available but a current snapshot will work on Python 2.7+ and 3.4+.
If you have multiple versions of wxPython installed, then the user code is
responsible setting the wxPython version. How to do this is
explained in the comment at the beginning of the example
examplesuser_interfacesembedding_in_wx2.py.
Some parameters have been added, others have been improved.
| Parameter | Description |
|---|---|
{x,y}axis.labelpad |
mplot3d now respects these parameters |
axes.labelpad |
Default space between the axis and the label |
errorbar.capsize |
Default length of end caps on error bars |
{x,y}tick.minor.visible |
Default visibility of minor x/y ticks |
legend.framealpha |
Default transparency of the legend frame box |
legend.facecolor |
Default facecolor of legend frame box (or
'inherit' from axes.facecolor) |
legend.edgecolor |
Default edgecolor of legend frame box (or
'inherit' from axes.edgecolor) |
figure.titlesize |
Default font size for figure suptitles |
figure.titleweight |
Default font weight for figure suptitles |
image.composite_image |
Whether a vector graphics backend should composite several images into a single image or not when saving. Useful when needing to edit the files further in Inkscape or other programs. |
markers.fillstyle |
Default fillstyle of markers. Possible values
are 'full' (the default), 'left',
'right', 'bottom', 'top' and
'none' |
toolbar |
Added 'toolmanager' as a valid value,
enabling the experimental ToolManager
feature. |
All selectors now implement set_active and get_active methods (also
called when accessing the active property) to properly update and query
whether they are active.
ignore, set_active, and get_active methods to base class Widget¶Pushes up duplicate methods in child class to parent class to avoid duplication of code.
A MultiCursor object can be disabled (and enabled) after it has been created without destroying the object. Example:
multi_cursor.active = False
Adds an interactive keyword which enables visible handles for manipulating the shape after it has been drawn.
Adds keyboard modifiers for:
Adds get_pixel_data and format_pixel_data methods to artists
which can be used to add zdata to the cursor display
in the status bar. Also adds an implementation for Images.
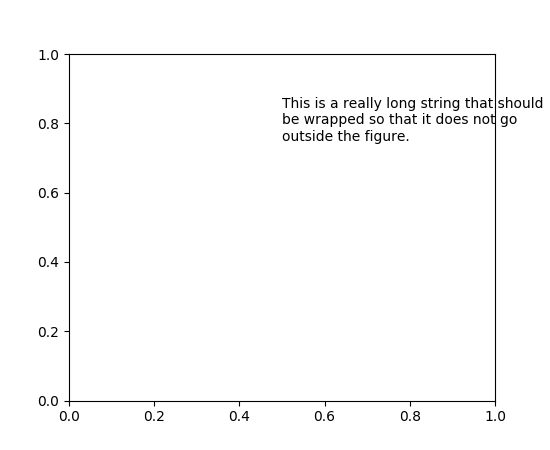
Added the keyword argument “wrap” to Text, which automatically breaks
long lines of text when being drawn. Works for any rotated text,
different modes of alignment, and for text that are either labels or
titles. This breaks at the Figure, not Axes edge.
(Source code, png, pdf)

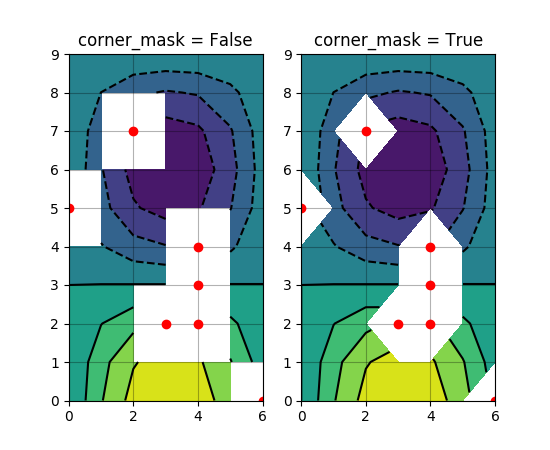
Ian Thomas rewrote the C++ code that calculates contours to add support for
corner masking. This is controlled by a new keyword argument
corner_mask in the functions contour() and
contourf(). The previous behaviour, which is now
obtained using corner_mask=False, was for a single masked point to
completely mask out all four quads touching that point. The new behaviour,
obtained using corner_mask=True, only masks the corners of those
quads touching the point; any triangular corners comprising three unmasked
points are contoured as usual. If the corner_mask keyword argument is not
specified, the default value is taken from rcParams.
(Source code, png, pdf)
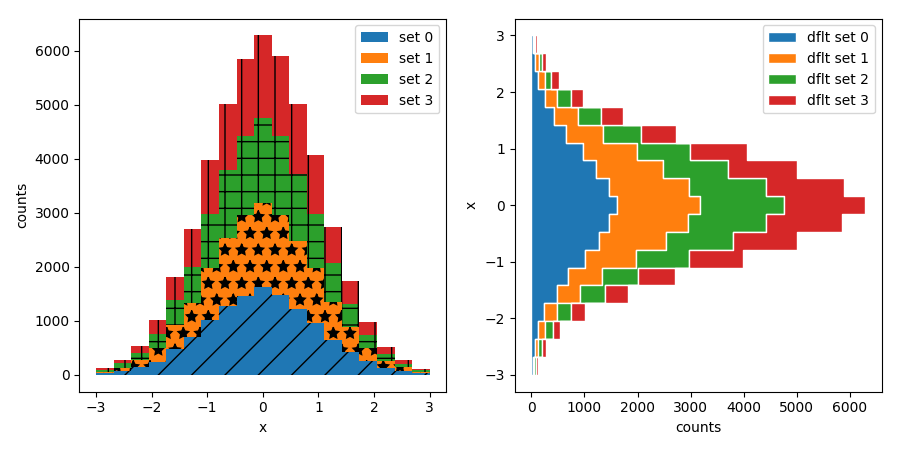
Line2D, Patch and Collection¶The handling of linestyles for Lines, Patches and Collections has been
unified. Now they all support defining linestyles with short symbols,
like "--", as well as with full names, like "dashed". Also the
definition using a dash pattern ((0., [3., 3.])) is supported for all
methods using Line2D, Patch or Collection.
Added ability to place the label before the marker in a legend box with
markerfirst keyword
Added a legend_handler for PolyCollection as well as a labels argument to
stackplot().
Added a pivot kwarg to quiver()
that controls the pivot point around which the quiver line rotates. This also
determines the placement of the arrow head along the quiver line.
Added support for the ‘logit’ axis scale, a nonlinear transformation

for data between 0 and 1 excluded.
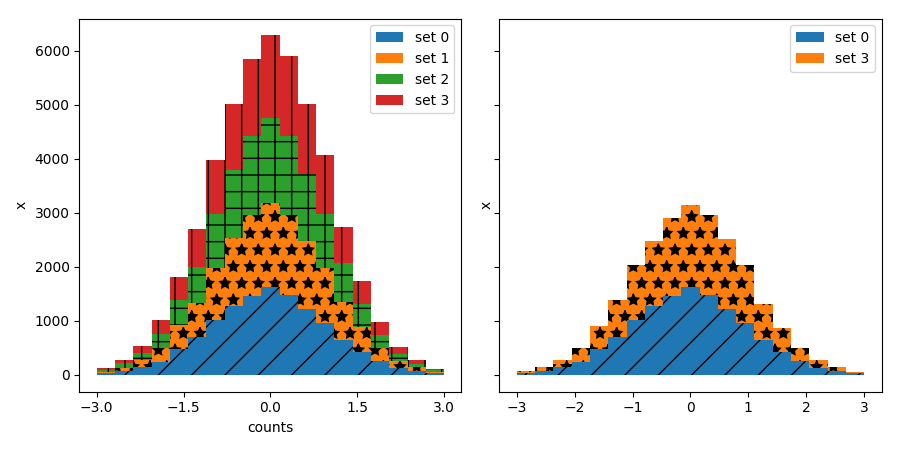
Added step kwarg to Axes.fill_between to allow to fill between
lines drawn using the ‘step’ draw style. The values of step match
those of the where kwarg of Axes.step. The asymmetry of of the
kwargs names is not ideal, but Axes.fill_between already has a
where kwarg.
This is particularly useful for plotting pre-binned histograms.
Implemented square plots feature as a new parameter in the axis
function. When argument ‘square’ is specified, equal scaling is set,
and the limits are set such that xmax-xmin == ymax-ymin.
(Source code, png, pdf)

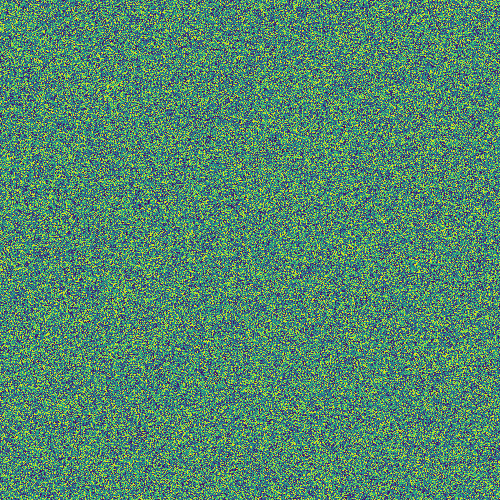
Added the ability to plot simple 2D-Array using plt.figimage(X, resize=True).
This is useful for plotting simple 2D-Array without the Axes or whitespacing
around the image.
(Source code, png, pdf)
Added support to save the figure with the same dpi as the figure on the
screen using dpi='figure'.
Example:
f = plt.figure(dpi=25)               # dpi set to 25
S = plt.scatter([1,2,3],[4,5,6])
f.savefig('output.png', dpi='figure')    # output savefig dpi set to 25 (same as figure)
Added the ability to toggle the visibility of lines in Tables.
Functionality added to the pyplot.table() factory function under
the keyword argument “edges”. Values can be the strings “open”, “closed”,
“horizontal”, “vertical” or combinations of the letters “L”, “R”, “T”,
“B” which represent left, right, top, and bottom respectively.
Example:
table(..., edges="open")  # No line visible
table(..., edges="closed")  # All lines visible
table(..., edges="horizontal")  # Only top and bottom lines visible
table(..., edges="LT")  # Only left and top lines visible.
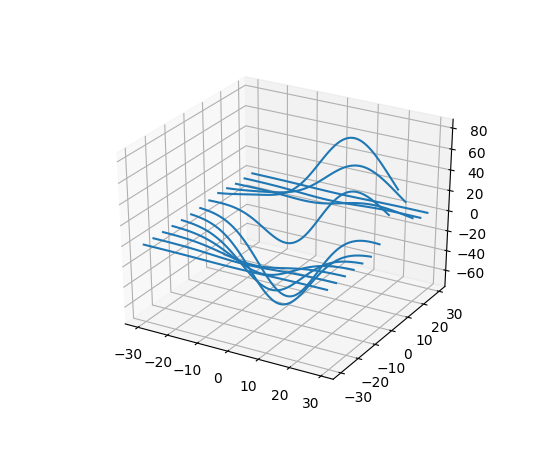
Adam Hughes added support to mplot3d’s plot_wireframe to draw only row or column line plots.
(Source code, png, pdf)
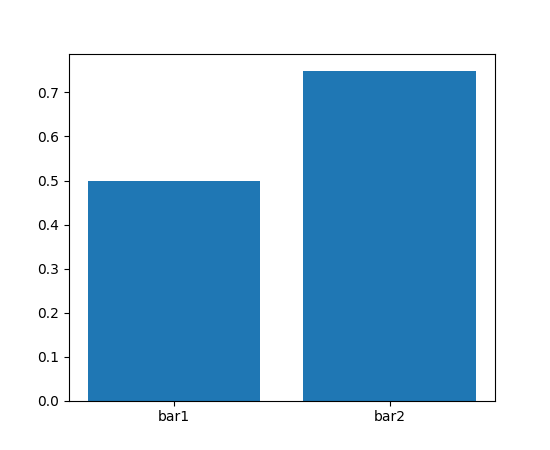
Added kwarg "tick_label" to bar and barh to support plotting bar graphs with a
text label for each bar.
(Source code, png, pdf)

These control where the center of the pie graph are and if the Axes frame is shown.
Certain cases of 3D filled contour plots that produce polygons with multiple
holes produced improper rendering due to a loss of path information between
PolyCollection and
Poly3DCollection. A function
set_verts_and_codes() was
added to allow path information to be retained for proper rendering.
Vector file formats (pdf, ps, svg) are efficient for many types of plot element, but for some they can yield excessive file size and even rendering artifacts, depending on the renderer used for screen display. This is a problem for colorbars that show a large number of shades, as is most commonly the case. Now, if a colorbar is showing 50 or more colors, it will be rasterized in vector backends.
strftime method will format
a datetime.datetime object with the format string passed to
the formatter’s constructor. This method accepts datetimes with years
before 1900, unlike datetime.datetime.strftime().
Add {get,set}_usetex methods to Text objects
which allow artist-level control of LaTeX rendering vs the internal mathtex
rendering.
ax.remove() works as expected¶As with artists added to an Axes,
Axes objects can be removed from their figure via
remove().
set_params() function, which sets parameters
within a Locator type
instance, is now available to all Locator types. The implementation
also prevents unsafe usage by strictly defining the parameters that a
user can set.
To use, call set_params() on a Locator instance with desired arguments:
loc = matplotlib.ticker.LogLocator()
# Set given attributes for loc.
loc.set_params(numticks=8, numdecs=8, subs=[2.0], base=8)
# The below will error, as there is no such parameter for LogLocator
# named foo
# loc.set_params(foo='bar')
Date Locators (derived from DateLocator) now
implement the tick_values() method.
This is expected of all Locators derived from Locator.
The Date Locators can now be used easily without creating axes
from datetime import datetime
from matplotlib.dates import YearLocator
t0 = datetime(2002, 10, 9, 12, 10)
tf = datetime(2005, 10, 9, 12, 15)
loc = YearLocator()
values = loc.tick_values(t0, tf)
Artists draw onto objects of type OffsetBox
through DrawingArea and TextArea.
The TextArea calculates the required space for the text and so the
text is always within the bounds, for this nothing has changed.
However, DrawingArea acts as a parent for zero or more Artists that
draw on it and may do so beyond the bounds. Now child Artists can be
clipped to the bounds of the DrawingArea.
When tight_layout() or Figure.tight_layout()
or GridSpec.tight_layout() is called, OffsetBoxes that are
anchored outside the axes will not get chopped out. The OffsetBoxes will
also not get overlapped by other axes in case of multiple subplots.
Add a new method attach_note()
to the PdfPages class, allowing the
attachment of simple text notes to pages in a multi-page pdf of
figures. The new note is visible in the list of pdf annotations in a
viewer that has this facility (Adobe Reader, OSX Preview, Skim,
etc.). Per default the note itself is kept off-page to prevent it to
appear in print-outs.
PdfPages.attach_note needs to be called before savefig() in order to be
added to the correct figure.
Added the ability to check the existence of a figure using its name instead of just the figure number. Example:
figure('figure')
fignum_exists('figure') #true
Federico Ariza wrote the new ToolManager
that comes as replacement for NavigationToolbar2
ToolManager offers a new way of looking at the user interactions
with the figures. Before we had the NavigationToolbar2 with its own
tools like zoom/pan/home/save/... and also we had the shortcuts like
yscale/grid/quit/.... Toolmanager relocate all those actions as
Tools (located in backend_tools), and defines a way to
access/trigger/reconfigure them.
The Toolbars are replaced for ToolContainers that are just GUI
interfaces to trigger the tools. But don’t worry the default
backends include a ToolContainer called toolbar
Note
At the moment, we release this primarily for feedback purposes and should
be treated as experimental until further notice as API changes will occur.
For the moment the ToolManager works only with the GTK3 and Tk backends.
Make sure you use one of those.
Port for the rest of the backends is comming soon.
To activate the ToolManager include the following at the top of your file
>>> matplotlib.rcParams['toolbar'] = 'toolmanager'
The most important feature is the ability to easily reconfigure the ToolContainer (aka toolbar). For example, if we want to remove the “forward” button we would just do.
>>> fig.canvas.manager.toolmanager.remove_tool('forward')
Now if you want to programmatically trigger the “home” button
>>> fig.canvas.manager.toolmanager.trigger_tool('home')
It is possible to add new tools to the ToolManager
A very simple tool that prints “You’re awesome” would be:
from matplotlib.backend_tools import ToolBase
class AwesomeTool(ToolBase):
    def trigger(self, *args, **kwargs):
        print("You're awesome")
To add this tool to ToolManager
>>> fig.canvas.manager.toolmanager.add_tool('Awesome', AwesomeTool)
If we want to add a shortcut (“d”) for the tool
>>> fig.canvas.manager.toolmanager.update_keymap('Awesome', 'd')
To add it to the toolbar inside the group ‘foo’
>>> fig.canvas.manager.toolbar.add_tool('Awesome', 'foo')
There is a second class of tools, “Toggleable Tools”, this are almost
the same as our basic tools, just that belong to a group, and are
mutually exclusive inside that group. For tools derived from
ToolToggleBase there are two basic methods enable and disable
that are called automatically whenever it is toggled.
A full example is located in user_interfaces example code: toolmanager.py
This is primarily how pandas stores a sequence of strings
import pandas as pd
import matplotlib.cbook as cbook

a = np.array(['a', 'b', 'c'])
print(cbook.is_sequence_of_strings(a))  # True

a = np.array(['a', 'b', 'c'], dtype=object)
print(cbook.is_sequence_of_strings(a))  # True

s = pd.Series(['a', 'b', 'c'])
print(cbook.is_sequence_of_strings(s))  # True
Previously, the last two prints returned false.
close-figs argument for plot directive¶Matplotlib has a sphinx extension plot_directive that creates plots for
inclusion in sphinx documents. Matplotlib 1.5 adds a new option to the plot
directive - close-figs - that closes any previous figure windows before
creating the plots. This can help avoid some surprising duplicates of plots
when using plot_directive.
imread¶The imread() function now accepts URL strings that
point to remote PNG files. This circumvents the generation of a
HTTPResponse object directly.
Animation instances gained a _repr_html_ method
to support inline display of animations in the notebook. The method used
to display is controlled by the animation.html rc parameter, which
currently supports values of none and html5. none is the
default, performing no display. html5 converts the animation to an
h264 encoded video, which is embedded directly in the notebook.
Users not wishing to use the _repr_html_ display hook can also manually
call the to_html5_video method to get the HTML and display using
IPython’s HTML display class:
from IPython.display import HTML
HTML(anim.to_html5_video())
Handling of pkg-config has been fixed in so far as it is now
possible to set it using the environment variable PKG_CONFIG. This
is important if your toolchain is prefixed. This is done in a simpilar
way as setting CC or CXX before building. An example follows.
export PKG_CONFIG=x86_64-pc-linux-gnu-pkg-config