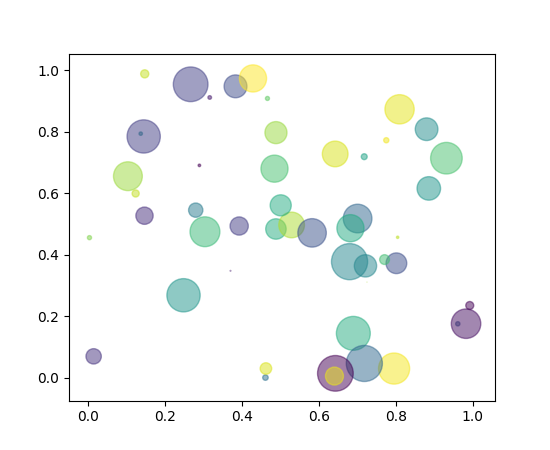
Axes.scatter(x, y, s=None, c=None, marker=None, cmap=None, norm=None, vmin=None, vmax=None, alpha=None, linewidths=None, verts=None, edgecolors=None, **kwargs)¶Make a scatter plot of x vs y
Marker size is scaled by s and marker color is mapped to c
| Parameters: | x, y : array_like, shape (n, )
s : scalar or array_like, shape (n, ), optional
c : color, sequence, or sequence of color, optional, default: ‘b’
marker :
cmap :
norm :
vmin, vmax : scalar, optional, default: None
alpha : scalar, optional, default: None
linewidths : scalar or array_like, optional, default: None
verts : sequence of (x, y), optional
edgecolors : color or sequence of color, optional, default: None
|
|---|---|
| Returns: | paths : |
| Other Parameters: | |
kwargs : |
|
See also
plotNotes
The plot function will be faster for scatterplots where markers
don’t vary in size or color.
Any or all of x, y, s, and c may be masked arrays, in which
case all masks will be combined and only unmasked points will be
plotted.
Fundamentally, scatter works with 1-D arrays; x, y, s, and c
may be input as 2-D arrays, but within scatter they will be
flattened. The exception is c, which will be flattened only if its
size matches the size of x and y.
Examples
(Source code, png, pdf)

Note
In addition to the above described arguments, this function can take a data keyword argument. If such a data argument is given, the following arguments are replaced by data[<arg>]: