

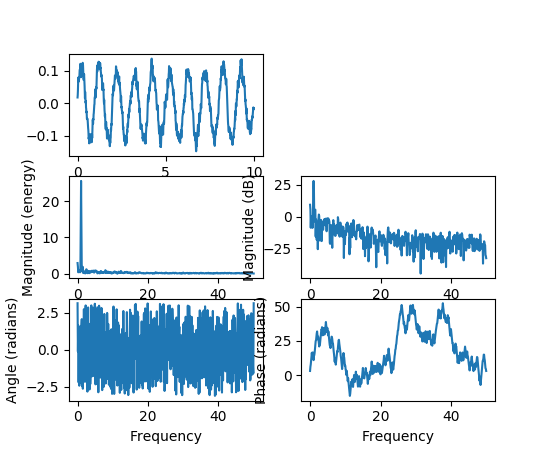
Axes.phase_spectrum(x, Fs=None, Fc=None, window=None, pad_to=None, sides=None, **kwargs)¶Plot the phase spectrum.
Call signature:
phase_spectrum(x, Fs=2, Fc=0,  window=mlab.window_hanning,
               pad_to=None, sides='default', **kwargs)
Compute the phase spectrum (unwrapped angle spectrum) of x. Data is padded to a length of pad_to and the windowing function window is applied to the signal.
| Parameters: | x : 1-D array or sequence
Fs : scalar
window : callable or ndarray
sides : [ ‘default’ | ‘onesided’ | ‘twosided’ ]
pad_to : integer
Fc : integer
**kwargs :
|
||||||||||||||||||||||||||||||||||||||||||||||||||||||||||||||||||||||||||||||||||||
|---|---|---|---|---|---|---|---|---|---|---|---|---|---|---|---|---|---|---|---|---|---|---|---|---|---|---|---|---|---|---|---|---|---|---|---|---|---|---|---|---|---|---|---|---|---|---|---|---|---|---|---|---|---|---|---|---|---|---|---|---|---|---|---|---|---|---|---|---|---|---|---|---|---|---|---|---|---|---|---|---|---|---|---|---|---|
| Returns: | spectrum : 1-D array
freqs : 1-D array
line : a
|
See also
magnitude_spectrum()magnitude_spectrum() plots the magnitudes of the corresponding frequencies.angle_spectrum()angle_spectrum() plots the wrapped version of this function.specgram()specgram() can plot the phase spectrum of segments within the signal in a colormap.Examples
(Source code, png, pdf)