

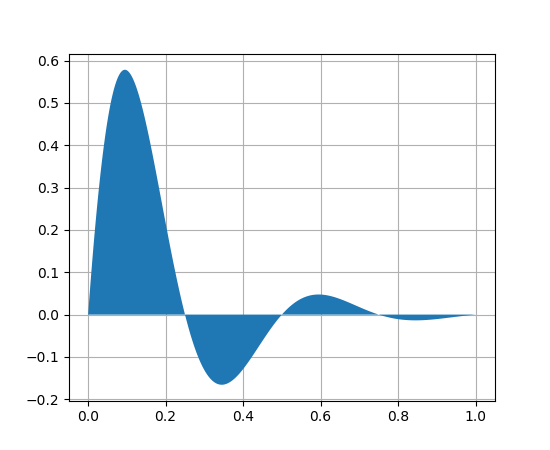
Axes.fill(*args, **kwargs)¶Plot filled polygons.
| Parameters: | args : a variable length argument
|
|---|---|
| Returns: | a list of |
| Other Parameters: | |
kwargs : |
|
Notes
The same color strings that plot()
supports are supported by the fill format string.
If you would like to fill below a curve, e.g., shade a region
between 0 and y along x, use fill_between()
Examples
(Source code, png, pdf)
Note
In addition to the above described arguments, this function can take a data keyword argument. If such a data argument is given, the following arguments are replaced by data[<arg>]: