

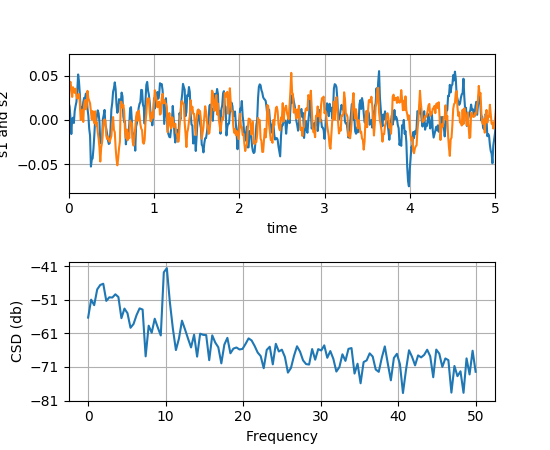
Axes.csd(x, y, NFFT=None, Fs=None, Fc=None, detrend=None, window=None, noverlap=None, pad_to=None, sides=None, scale_by_freq=None, return_line=None, **kwargs)¶Plot the cross-spectral density.
Call signature:
csd(x, y, NFFT=256, Fs=2, Fc=0, detrend=mlab.detrend_none,
    window=mlab.window_hanning, noverlap=0, pad_to=None,
    sides='default', scale_by_freq=None, return_line=None, **kwargs)
The cross spectral density  by Welch’s average
periodogram method. The vectors x and y are divided into
NFFT length segments. Each segment is detrended by function
detrend and windowed by function window. noverlap gives
the length of the overlap between segments. The product of
the direct FFTs of x and y are averaged over each segment
to compute , with a scaling to correct for power
loss due to windowing.
by Welch’s average
periodogram method. The vectors x and y are divided into
NFFT length segments. Each segment is detrended by function
detrend and windowed by function window. noverlap gives
the length of the overlap between segments. The product of
the direct FFTs of x and y are averaged over each segment
to compute , with a scaling to correct for power
loss due to windowing.
If len(x) < NFFT or len(y) < NFFT, they will be zero padded to NFFT.
| Parameters: | x, y : 1-D arrays or sequences
Fs : scalar
window : callable or ndarray
sides : [ ‘default’ | ‘onesided’ | ‘twosided’ ]
pad_to : integer
NFFT : integer
detrend : {‘default’, ‘constant’, ‘mean’, ‘linear’, ‘none’} or callable
scale_by_freq : boolean, optional
noverlap : integer
Fc : integer
return_line : bool
**kwargs :
|
||||||||||||||||||||||||||||||||||||||||||||||||||||||||||||||||||||||||||||||||||||
|---|---|---|---|---|---|---|---|---|---|---|---|---|---|---|---|---|---|---|---|---|---|---|---|---|---|---|---|---|---|---|---|---|---|---|---|---|---|---|---|---|---|---|---|---|---|---|---|---|---|---|---|---|---|---|---|---|---|---|---|---|---|---|---|---|---|---|---|---|---|---|---|---|---|---|---|---|---|---|---|---|---|---|---|---|---|
| Returns: | Pxy : 1-D array
freqs : 1-D array
line : a
|
See also
Notes
For plotting, the power is plotted as
 for decibels, though
 P_{xy} itself
is returned.
References
Bendat & Piersol – Random Data: Analysis and Measurement Procedures, John Wiley & Sons (1986)
Examples
(Source code, png, pdf)