| Parameters: | x : Array or a sequence of vectors.
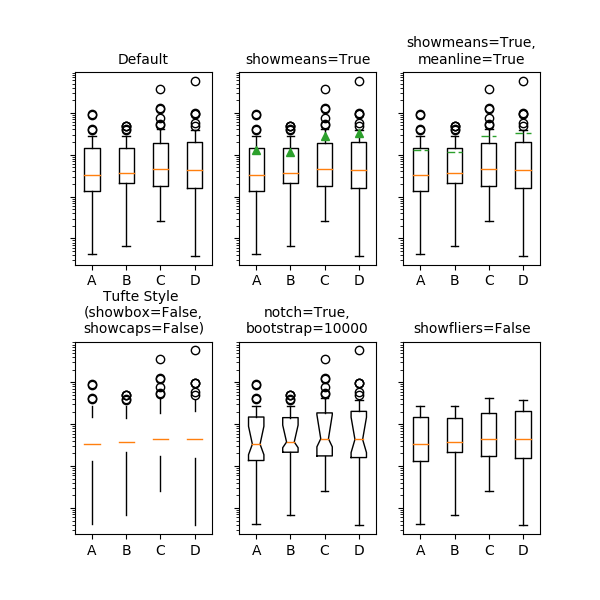
notch : bool, optional (False)
If True, will produce a notched box plot. Otherwise, a
rectangular boxplot is produced. The notches represent the
confidence interval (CI) around the median. See the entry
for the bootstrap parameter for information regarding
how the locations of the notches are computed.
Note
In cases where the values of the CI are less than the
lower quartile or greater than the upper quartile, the
notches will extend beyond the box, giving it a
distinctive “flipped” appearance. This is expected
behavior and consistent with other statistical
visualization packages.
sym : str, optional
The default symbol for flier points. Enter an empty string
(‘’) if you don’t want to show fliers. If None, then the
fliers default to ‘b+’ If you want more control use the
flierprops kwarg.
vert : bool, optional (True)
If True (default), makes the boxes vertical. If False,
everything is drawn horizontally.
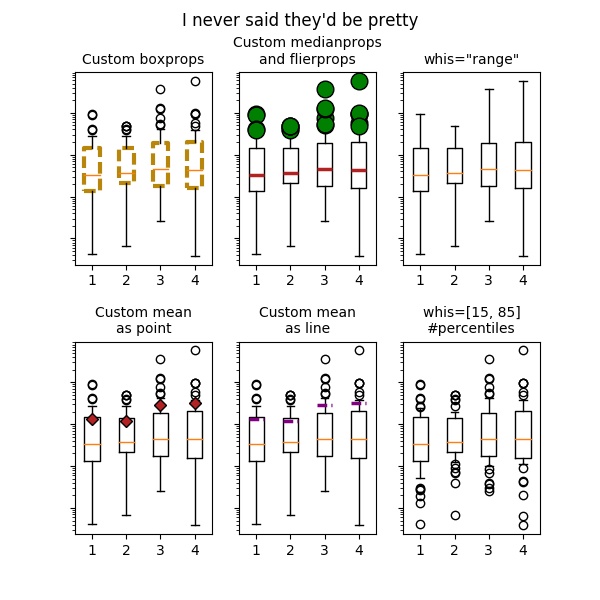
whis : float, sequence, or string (default = 1.5)
As a float, determines the reach of the whiskers past the
first and third quartiles (e.g., Q3 + whis*IQR,
IQR = interquartile range, Q3-Q1). Beyond the whiskers, data
are considered outliers and are plotted as individual
points. Set this to an unreasonably high value to force the
whiskers to show the min and max values. Alternatively, set
this to an ascending sequence of percentile (e.g., [5, 95])
to set the whiskers at specific percentiles of the data.
Finally, whis can be the string 'range' to force the
whiskers to the min and max of the data.
bootstrap : int, optional
Specifies whether to bootstrap the confidence intervals
around the median for notched boxplots. If bootstrap is
None, no bootstrapping is performed, and notches are
calculated using a Gaussian-based asymptotic approximation
(see McGill, R., Tukey, J.W., and Larsen, W.A., 1978, and
Kendall and Stuart, 1967). Otherwise, bootstrap specifies
the number of times to bootstrap the median to determine its
95% confidence intervals. Values between 1000 and 10000 are
recommended.
usermedians : array-like, optional
An array or sequence whose first dimension (or length) is
compatible with x. This overrides the medians computed
by matplotlib for each element of usermedians that is not
None. When an element of usermedians is None, the median
will be computed by matplotlib as normal.
conf_intervals : array-like, optional
Array or sequence whose first dimension (or length) is
compatible with x and whose second dimension is 2. When
the an element of conf_intervals is not None, the
notch locations computed by matplotlib are overridden
(provided notch is True). When an element of
conf_intervals is None, the notches are computed by the
method specified by the other kwargs (e.g., bootstrap).
positions : array-like, optional
Sets the positions of the boxes. The ticks and limits are
automatically set to match the positions. Defaults to
range(1, N+1) where N is the number of boxes to be drawn.
widths : scalar or array-like
Sets the width of each box either with a scalar or a
sequence. The default is 0.5, or 0.15*(distance between
extreme positions), if that is smaller.
patch_artist : bool, optional (False)
If False produces boxes with the Line2D artist. Otherwise,
boxes and drawn with Patch artists.
labels : sequence, optional
Labels for each dataset. Length must be compatible with
dimensions of x.
manage_xticks : bool, optional (True)
If the function should adjust the xlim and xtick locations.
autorange : bool, optional (False)
When True and the data are distributed such that the 25th and
75th percentiles are equal, whis is set to 'range' such
that the whisker ends are at the minimum and maximum of the
data.
meanline : bool, optional (False)
If True (and showmeans is True), will try to render
the mean as a line spanning the full width of the box
according to meanprops (see below). Not recommended if
shownotches is also True. Otherwise, means will be shown
as points.
zorder : scalar, optional (None)
Sets the zorder of the boxplot.
|
|---|
| | showcaps : bool, optional (True)
Show the caps on the ends of whiskers.
showbox : bool, optional (True)
showfliers : bool, optional (True)
Show the outliers beyond the caps.
showmeans : bool, optional (False)
Show the arithmetic means.
capprops : dict, optional (None)
Specifies the style of the caps.
boxprops : dict, optional (None)
Specifies the style of the box.
whiskerprops : dict, optional (None)
Specifies the style of the whiskers.
flierprops : dict, optional (None)
Specifies the style of the fliers.
medianprops : dict, optional (None)
Specifies the style of the median.
meanprops : dict, optional (None)
Specifies the style of the mean.
|

