

Axes.bar(left, height, width=0.8, bottom=None, **kwargs)¶Make a bar plot.
Make a bar plot with rectangles bounded by:
left,left+width,bottom,bottom+height- (left, right, bottom and top edges)
| Parameters: | left : sequence of scalars
height : sequence of scalars
width : scalar or array-like, optional
bottom : scalar or array-like, optional
color : scalar or array-like, optional
edgecolor : scalar or array-like, optional
linewidth : scalar or array-like, optional
tick_label : string or array-like, optional
xerr : scalar or array-like, optional
yerr : scalar or array-like, optional
ecolor : scalar or array-like, optional
capsize : scalar, optional
error_kw : dict, optional
align : {‘center’, ‘edge’}, optional
orientation : {‘vertical’, ‘horizontal’}, optional
log : boolean, optional
|
|---|---|
| Returns: | bars : matplotlib.container.BarContainer
|
See also
barhNotes
The optional arguments color, edgecolor, linewidth,
xerr, and yerr can be either scalars or sequences of
length equal to the number of bars. This enables you to use
bar as the basis for stacked bar charts, or candlestick plots.
Detail: xerr and yerr are passed directly to
errorbar(), so they can also have shape 2xN for
independent specification of lower and upper errors.
Other optional kwargs:
Property Description agg_filterunknown alphafloat or None animated[True | False] antialiasedor aa[True | False] or None for default axesan Axesinstancecapstyle[‘butt’ | ‘round’ | ‘projecting’] clip_boxa matplotlib.transforms.Bboxinstanceclip_on[True | False] clip_path[ ( Path,Transform) |Patch| None ]colormatplotlib color spec containsa callable function edgecoloror ecmpl color spec, None, ‘none’, or ‘auto’ facecoloror fcmpl color spec, or None for default, or ‘none’ for no color figurea matplotlib.figure.Figureinstancefill[True | False] gidan id string hatch[‘/’ | ‘\’ | ‘|’ | ‘-‘ | ‘+’ | ‘x’ | ‘o’ | ‘O’ | ‘.’ | ‘*’] joinstyle[‘miter’ | ‘round’ | ‘bevel’] labelstring or anything printable with ‘%s’ conversion. linestyleor ls[‘solid’ | ‘dashed’, ‘dashdot’, ‘dotted’ | (offset, on-off-dash-seq) | '-'|'--'|'-.'|':'|'None'|' '|'']linewidthor lwfloat or None for default path_effectsunknown picker[None|float|boolean|callable] rasterized[True | False | None] sketch_paramsunknown snapunknown transformTransforminstanceurla url string visible[True | False] zorderany number
Examples
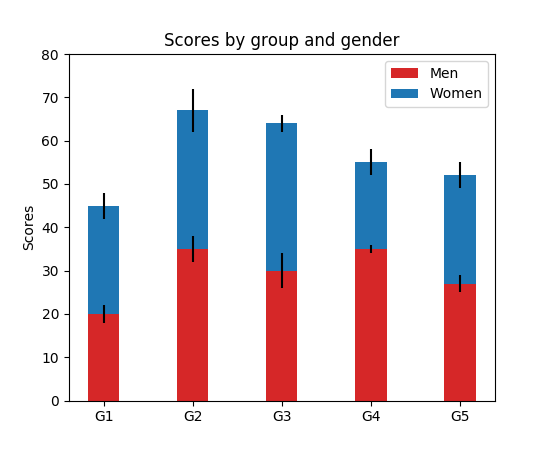
Example: A stacked bar chart.
(Source code, png, pdf)
Note
In addition to the above described arguments, this function can take a data keyword argument. If such a data argument is given, the following arguments are replaced by data[<arg>]: