Diagnosing Performance
Understanding the performance of a distributed computation can be difficult. This is due in part to the many components of a distributed computer that may impact performance:
Compute time
Memory bandwidth
Network bandwidth
Disk bandwidth
Scheduler overhead
Serialization costs
This difficulty is compounded because the information about these costs is spread among many machines and so there is no central place to collect data to identify performance issues.
Fortunately, Dask collects a variety of diagnostic information during execution. It does this both to provide performance feedback to users, but also for its own internal scheduling decisions. The primary place to observe this feedback is the diagnostic dashboard. This document describes the various pieces of performance information available and how to access them.
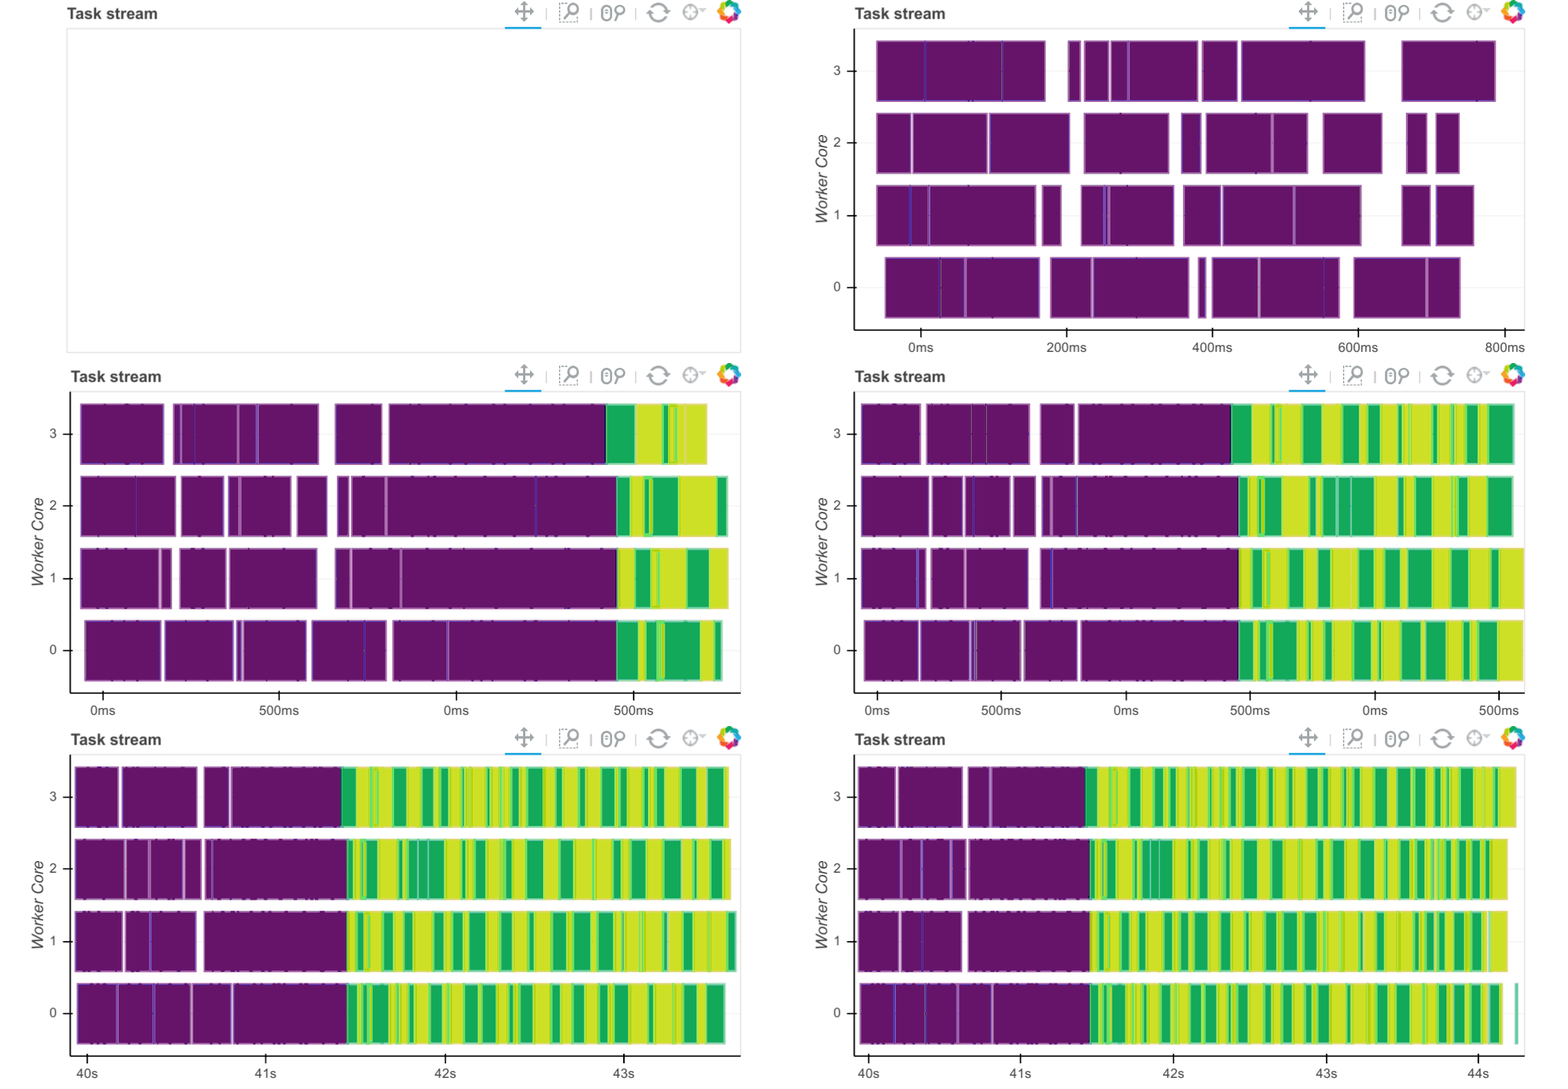
Task start and stop times
Workers capture durations associated to tasks. For each task that passes through a worker we record start and stop times for each of the following:
Serialization (gray)
Dependency gathering from peers (red)
Disk I/O to collect local data (orange)
Execution times (colored by task)
The main way to observe these times is with the task stream plot on the
scheduler’s /status page where the colors of the bars correspond to the
colors listed above.

Alternatively if you want to do your own diagnostics on every task event you might want to create a Scheduler plugin. All of this information will be available when a task transitions from processing to memory or erred.
Statistical Profiling
For single-threaded profiling Python users typically depend on the CProfile module in the standard library (Dask developers recommend the snakeviz tool for single-threaded profiling). Unfortunately the standard CProfile module does not work with multi-threaded or distributed computations.
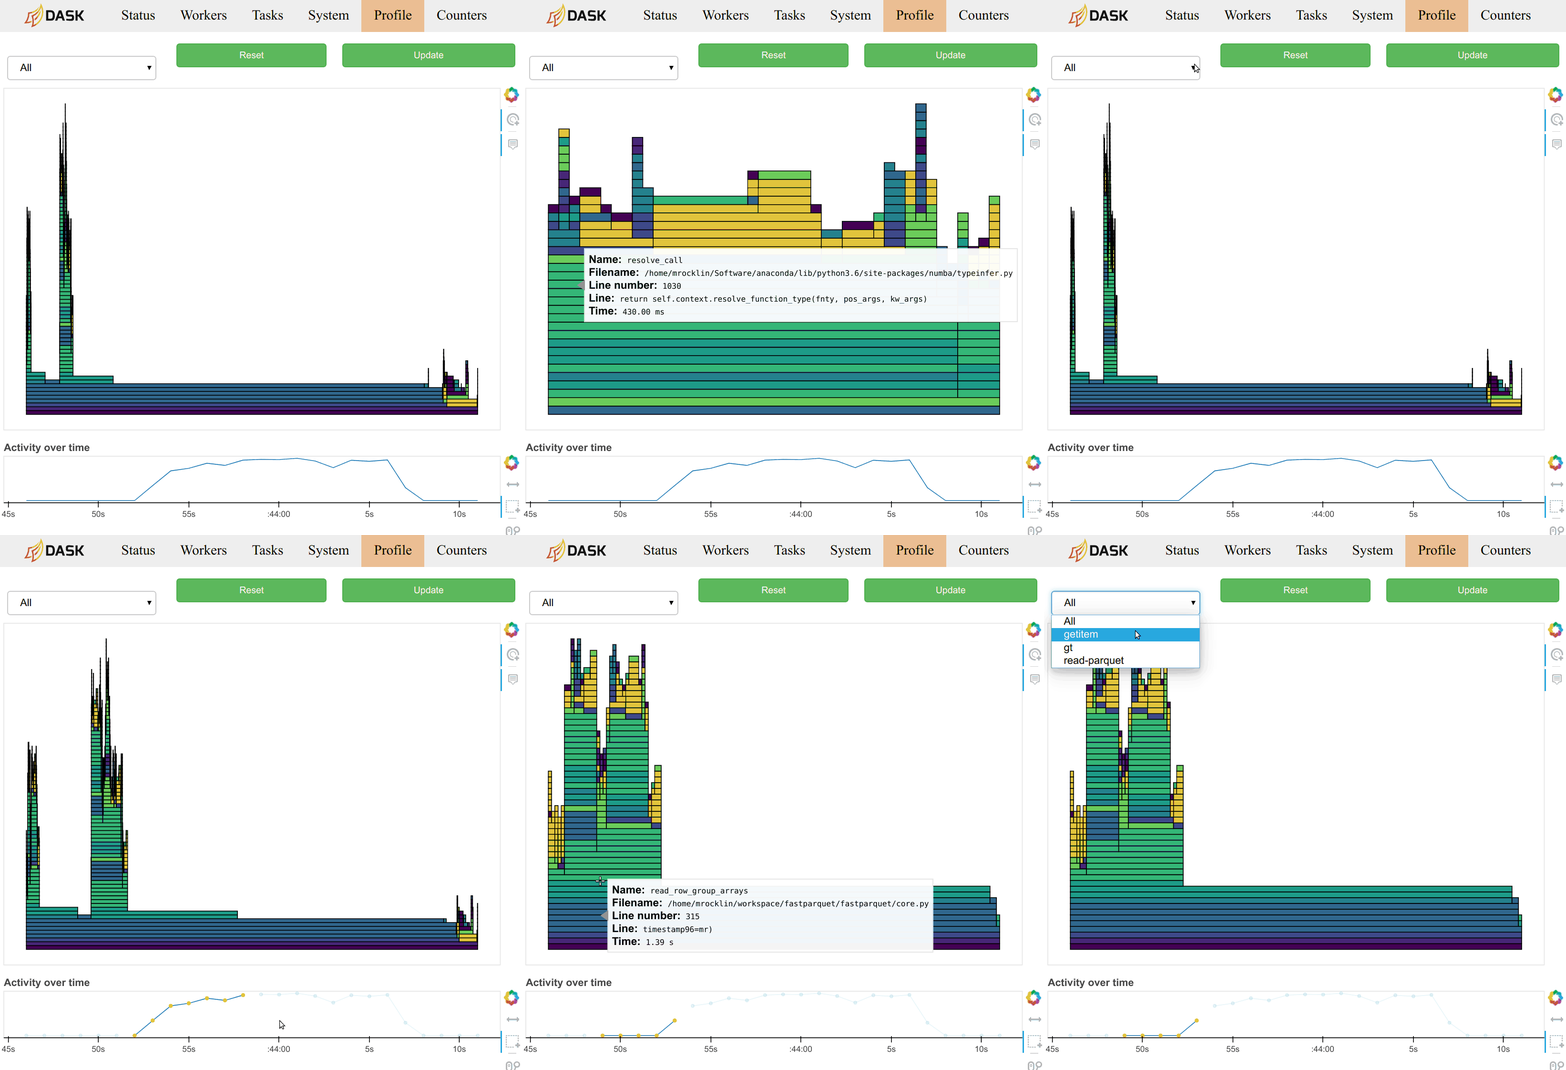
To address this Dask implements its own distributed statistical profiler. Every 10ms each worker process checks what each of its worker threads are doing. It captures the call stack and adds this stack to a counting data structure. This counting data structure is recorded and cleared every second in order to establish a record of performance over time.
Users typically observe this data through the /profile plot on either the
worker or scheduler diagnostic dashboards. On the scheduler page they observe
the total profile aggregated over all workers over all threads. Clicking on
any of the bars in the profile will zoom the user into just that section, as is
typical with most profiling tools. There is a timeline at the bottom of the
page to allow users to select different periods in time.

Profiles are also grouped by the task that was being run at the time. You can
select a task name from the selection menu at the top of the page. You can
also click on the rectangle corresponding to the task in the main task stream
plot on the /status page.
Users can also query this data directly using the Client.profile
function. This will deliver the raw data structure used to produce these
plots. They can also pass a filename to save the plot as an HTML file
directly. Note that this file will have to be served from a webserver like
python -m http.server to be visible.
The 10ms and 1s parameters can be controlled by the profile-interval and
profile-cycle-interval entries in the config.yaml file.
Bandwidth
Dask workers track every incoming and outgoing transfer in the
Worker.outgoing_transfer_log and Worker.incoming_transfer_log
attributes including
Total bytes transferred
Compressed bytes transferred
Start/stop times
Keys moved
Peer
These are made available to users through the /status page of the Worker’s
diagnostic dashboard. You can capture their state explicitly by running a
command on the workers:
client.run(lambda dask_worker: dask_worker.outgoing_transfer_log)
client.run(lambda dask_worker: dask_worker.incoming_transfer_log)
Performance Reports
Often when benchmarking and/or profiling, users may want to record a
particular computation or even a full workflow. Dask can save the bokeh
dashboards as static HTML plots including the task stream, worker profiles,
bandwidths, etc. This is done wrapping a computation with the performance_report context manager:
from dask.distributed import performance_report

with performance_report(filename="dask-report.html"):
    ## some dask computation
The following video demonstrates the performance_report context manager in greater
detail:
A note about times
Different computers maintain different clocks which may not match perfectly. To address this the Dask scheduler sends its current time in response to every worker heartbeat. Workers compare their local time against this time to obtain an estimate of differences. All times recorded in workers take this estimated delay into account. This helps, but still, imprecise measurements may exist.
All times are intended to be from the scheduler’s perspective.