| Oracle® Database 2 Day + Performance Tuning Guide 11g Release 2 (11.2) Part Number E10822-04 |
|
|
PDF · Mobi · ePub |
| Oracle® Database 2 Day + Performance Tuning Guide 11g Release 2 (11.2) Part Number E10822-04 |
|
|
PDF · Mobi · ePub |
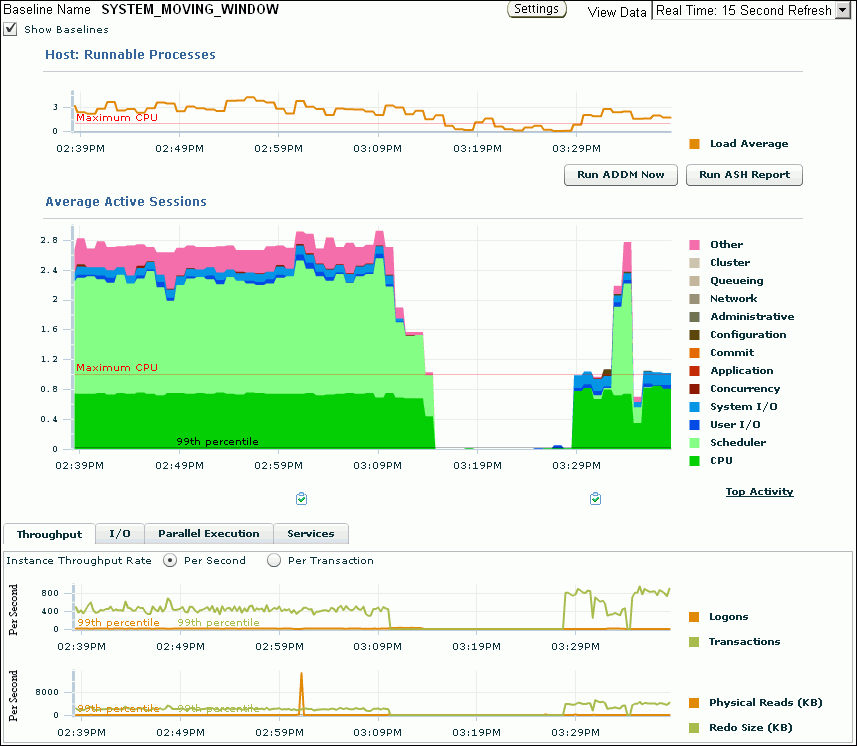
The Performance page in Oracle Enterprise Manager (Enterprise Manager) displays information in three sections that you can use to assess the overall performance of the database in real time.
Figure 4-1 shows the Performance page.
Typically, you should use the automatic diagnostic feature of Automatic Database Diagnostic Monitor (ADDM) to identify performance problems with the database, as described in Chapter 3, "Automatic Database Performance Monitoring". In some cases, you may want to monitor the database performance in real time to identify performance problems as they occur. For example, ADDM performs its analysis after each Automatic Workload Repository (AWR) snapshot, which by default is once every hour. However, if you notice a sudden spike in database activity on the Performance page, then you may want to investigate the incident before the next ADDM analysis.
By drilling down to other pages from the Performance page, you can identify database performance problems in real time. If you find a problem, then you can run ADDM manually to analyze it immediately without having to wait until the next ADDM analysis. To learn how to run ADDM manually, see "Manually Running ADDM to Analyze Current Database Performance".
This chapter contains the following sections:
The Average Active Sessions chart of the Performance page shows the average load on the database. The average active sessions for a time period equals the total DB time of all sessions during this period divided by the elapsed time (wall clock time) for this period. The chart shows which active sessions are running on the CPU or waiting on an event.
By following the performance method explained in Chapter 2, "Oracle Database Performance Method", you can drill down from the charts to identify the causes of instance-related performance issues and resolve them.
To monitor user activity:
From the Database Home page, click Performance.
The Performance page appears.
Locate any sudden increases in the Average Active Sessions chart.
Each component shows the average number of active sessions in the specified state for the specified time. For example, if only one session were active, then the value .8 for CPU would mean that the session consumed CPU in 4 of 5 sampled seconds around the target time. The Maximum CPU equals the number of CPUs on the system. When the CPU Used value reaches the Maximum CPU line, the database instance is consuming 100 percent of CPU time on the host system.
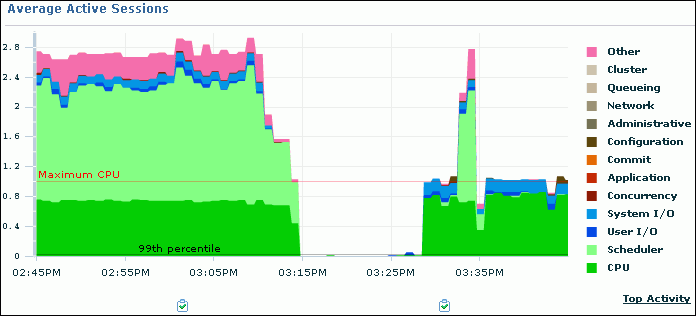
The wait classes show how much database activity is consumed by waiting for a resource such as disk I/O. Values that use a larger block of active sessions represent bottlenecks caused by a particular wait class, as indicated by the corresponding color in the legend.
In the chart shown in Figure 4-2, the largest amount of activity after 3:35 p.m. appears in dark green and corresponds to the CPU Used wait class.
To identify each wait class, move your cursor over the block in the Average Active Sessions chart corresponding to the class.
The corresponding wait class is highlighted in the chart legend.
Click the largest block of color on the chart or its corresponding wait class in the legend to drill down to the wait class with the most active sessions.
If you click CPU Used, then the Active Sessions Working page for the wait class appears. If you click a different wait class, such as User I/O, then the Active Sessions Waiting page appears.
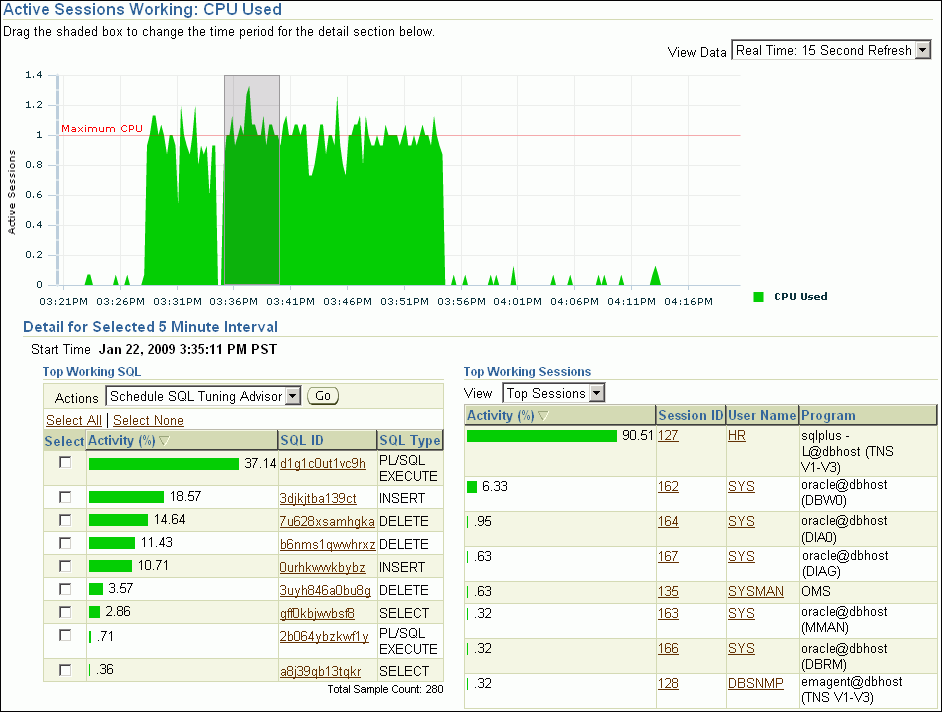
The Active Sessions Working page shows a 1-hour timeline. Details for each wait class are shown in 5-minute intervals under Detail for Selected 5 Minute Interval.
You can view the details of wait classes in different dimensions by proceeding to one of the following sections:
To change the selected time interval, move the slider below the chart to a different interval.
The information contained in the Detail for Selected 5 Minute Interval section is automatically updated to display the selected time period.
In the example shown in Figure 4-3, the 5 -minute interval from 5:03 to 5:08 is selected for the CPU Used wait class.
If you discover a performance problem, then you can attempt to resolve it in real time. On the Performance page, do one of the following:
Below the chart, click the snapshot corresponding to the time when the performance problem occurred to run ADDM for this time period.
For information about ADDM analysis, see "Reviewing the Automatic Database Diagnostic Monitor Analysis".
Click Run ADDM Now to create a snapshot manually.
For information about creating snapshots manually, see "Creating Snapshots". For information about running ADDM manually, see "Manually Running ADDM to Analyze Current Database Performance".
Click Run ASH Report to create an Active Session History (ASH) report to analyze transient, short-lived performance problems.
For information about ASH reports, see "Active Session History Reports".
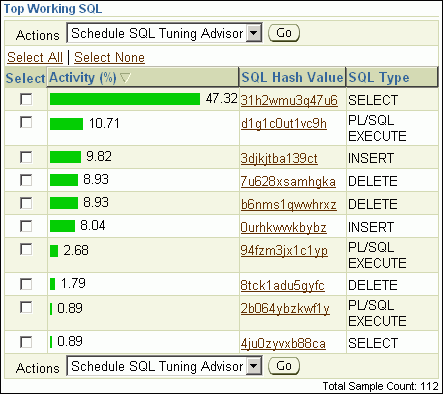
On the Active Sessions Working page, the Top Working SQL table shows the database activity for actively running SQL statements that are consuming CPU resources. The Activity (%) column shows the percentage of this activity consumed by each SQL statement. If one or several SQL statements are consuming most of the activity, then you should investigate them.
In the example shown in Figure 4-4, a single SELECT statement is consuming over 47% of database activity, while four modification DML statements are consuming about 35%. These statements should be investigated.
To monitor the top working SQL statements:
On the Performance page, in the Average Active Sessions chart, click the CPU block on the chart or its corresponding wait class in the legend.
The Active Sessions Working page appears.
In the Top Working SQL table, click the SQL ID link of the most active SQL statement.
The SQL Details page appears.
For SQL statements that are using the majority of the wait time, use SQL Tuning Advisor or create a SQL tuning set to tune the problematic SQL statements.
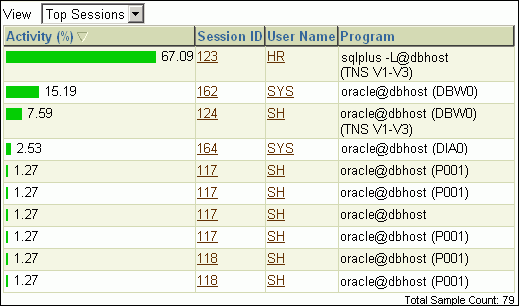
On the Active Sessions Working page, the Top Working Sessions table displays the top sessions waiting for the corresponding wait class during the selected time period. A session is a logical entity in the database instance memory that represents the state of a current user login to the database.
A session lasts from the time a user logs in to the database until the user disconnects. For example, when a user starts SQL*Plus, the user must provide a valid database user name and password to establish a session. If a single session is consuming the majority of database activity, then you should investigate it.
To monitor the top working sessions:
On the Performance page, in the Average Active Sessions chart, click the CPU Used block on the chart or its corresponding wait class in the legend.
The Active Sessions Working page appears.
Under Detail for Selected 5 Minute Interval, select Top Sessions from the View list.
The Top Working Sessions table appears.
In the Top Working Sessions table, click the Session ID link of the session consuming the most database activity.
The Session Details page appears.
This page contains information such as session activity, session statistics, open cursors, blocking sessions, wait events, and parallel SQL for the selected session.
If a session is consuming too much database activity, then consider clicking Kill Session, and then tuning the session's SQL statement.
See Also:
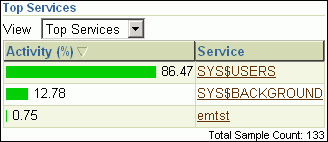
The Top Services table displays the top services waiting for the corresponding wait event during the selected time period.
A service is a group of of applications with common attributes, service-level thresholds, and priorities. For example, the SYS$USERS service is the default service name used when a user session is established without explicitly identifying its service name. The SYS$BACKGROUND service consists of all database background processes. If a service is using the majority of the wait time, then you should investigate it.
To monitor a service:
On the Performance page, in the Average Active Sessions chart, click a block on the chart or its corresponding wait class in the legend.
The Active Sessions Working page appears.
Under Detail for Selected 5 Minute Interval, select Top Services from the View list.
The Top Services table appears.
In the example shown in Figure 4-6, the SYS$USERS service is consuming 86.47% of database activity. This service corresponds to the database sessions for users hr and sh shown in Figure 4-5.
Click the Service link of the most active service.
The Service page appears.
This page contains information about the modules, activity, and statistics for the selected service.
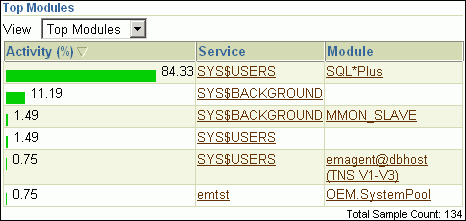
The Top Modules table displays the top modules waiting for the corresponding wait event during the selected time period.
Modules represent the applications that set the service name as part of the workload definition. For example, the DBMS_SCHEDULER module may assign jobs that run within the SYS$BACKGROUND service. If a single module is using the majority of the wait time, then it should be investigated.
To monitor a module:
On the Performance page, in the Average Active Sessions chart, click a block on the chart or its corresponding wait class in the legend.
The Active Sessions Working page appears.
Under Detail for Selected 5 Minute Interval, select Top Modules from the View list.
The Top Modules table appears.
Click the Module link of the module that is showing the highest percentage of activity.
The Module page appears.
This page contains information about the actions, activity, and statistics for the selected module.
In the example shown in Figure 4-7, the SQL*Plus module is consuming over 84% of database activity and should be investigated. As shown in Figure 4-5, the SQL*Plus session for users sh and hr are consuming a huge percentage of database activity.
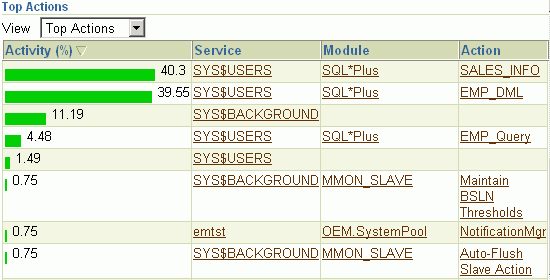
The Top Actions table displays the top actions waiting for the corresponding wait event during the selected time period.
Actions represent the jobs that are performed by a module. For example, the DBMS_SCHEDULER module can run the GATHER_STATS_JOB action to gather statistics on all database objects. If a single action is using the majority of the wait time, then you should investigate it.
To monitor an action:
On the Performance page, in the Average Active Sessions chart, click a block on the chart or its corresponding wait class in the legend.
The Active Sessions Working page appears.
Under Detail for Selected 5 Minute Interval, select Top Actions from the View list.
The Top Actions table appears.
Click the Action link of the most active action.
The Action page appears.
This page contains statistics for the selected action.
In the example shown in Figure 4-8, the SALES_INFO action associated with the SQL*Plus module is consuming 40.3% of the database activity, while EMP_DML is consuming 39.55% and EMP_QUERY is consuming 4.48%. This information is consistent with Figure 4-5, which shows that the two database sessions for users HR and SH are consuming over 84% of database activity.
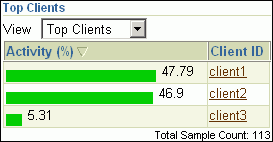
The Top Clients table displays the top clients waiting for the corresponding wait event during the selected time period. A client can be a Web browser or any client process that initiates requests for an operation to be performed by the database. If a single client is using the majority of the wait time, then you should investigate it.
To monitor a client:
On the Performance page, in the Average Active Sessions chart, click a block on the chart or its corresponding wait class in the legend.
The Active Sessions Working page appears.
Under Detail for Selected 5 Minute Interval, select Top Clients from the View list.
The Top Clients table appears.
Click the Client ID link of the most active client.
The Clients page appears.
This page contains statistics for the selected client process.
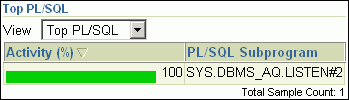
The Top PL/SQL table displays the top PL/SQL subprograms waiting for the corresponding wait event during the selected time period. If a single PL/SQL subprogram is using the majority of the wait time, then you should investigate it.
To monitor a PL/SQL subprogram:
On the Performance page, in the Average Active Sessions chart, click a block on the chart or its corresponding wait class in the legend.
The Active Sessions Working page appears.
Under Detail for Selected 5 Minute Interval, select Top PL/SQL from the View list.
The Top PL/SQL table appears.
Click the PL/SQL Subprogram link of the most active subprogram.
The PL/SQL Subprogram page appears.
This page contains statistics for the selected subprogram.
In Figure 4-10, the SYS.DBMS_AQ.LISTEN#2 subprogram is consuming 100% of database activity.
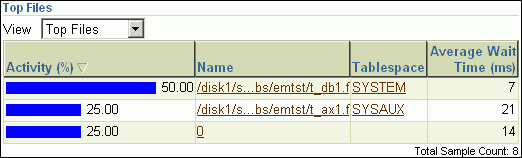
The Top Files table displays the average wait time for specific files during the selected time period. This data is available from the Active Sessions Waiting: User I/O page.
To monitor a file:
On the Performance page, in the Average Active Sessions chart, click the User I/O block on the chart or its corresponding wait class in the legend.
The Active Sessions Waiting: User I/O page appears.
Under Detail for Selected 5 Minute Interval, select Top Files from the View list.
The Top Files table appears.
Click the Tablespace link of the file with the highest average wait time.
The View Tablespace page appears.
In the example shown in Figure 4-11, 75% of the wait times are associated with I/O to the files in the SYSTEM and SYSAUX tablespaces.
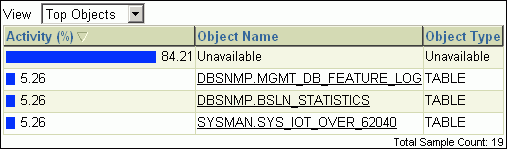
The Top Objects table displays the top database objects waiting for the corresponding wait event during the selected time period. This data is available from the Active Sessions Waiting: User I/O page.
To monitor an object:
On the Performance page, in the Average Active Sessions chart, click the User I/O block on the chart or its corresponding wait class in the legend.
The Active Sessions Waiting: User I/O page appears.
Under Detail for Selected 5 Minute Interval, select Top Objects from the View list.
The Top Objects table appears.
Click the Object Name link of the object with the highest average wait time.
The View page for the object appears.
This example in Figure 4-12 shows that over 84% of the waits are for an object whose name is unavailable. Based on the information in Figure 4-4 and Figure 4-5, you can conclude that the performance problem is caused by the query and modification DML statements.
In the Average Active Sessions section of the Performance page, you can use the instance charts to monitor database instance activity. As explained in "Customizing the Database Performance Page", you can also customize the Performance page so that the most useful charts are displayed by default.
You can use the instance activity charts to perform the following tasks:
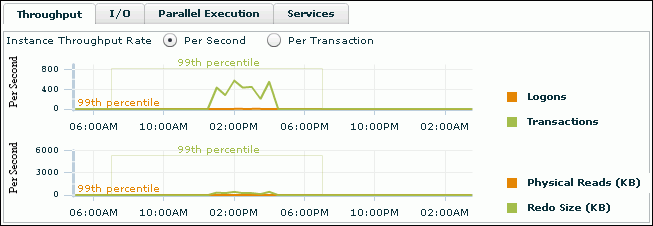
Database throughput measures the amount of work the database performs in a unit of time. The Throughput charts show any contention that appears in the Average Active Sessions chart. The Throughput charts on the Performance page display:
Number of logons, transactions, physical reads, and redo size per second
Number of physical reads and redo size per transaction
Compare the peaks on the Throughput charts with the peaks on the Average Active Sessions chart. If the Average Active Sessions chart displays a large number of sessions waiting, indicating internal contention, but throughput is high, then the situation may be acceptable. The database is probably also performing efficiently if internal contention is low but throughput is high. However, if internal contention is high but throughput is low, then consider tuning the database.
To monitor throughput:
From the Database Home page, click Performance.
The Performance page appears.
In the instance activity chart, click Throughput.
The Throughput charts are shown with Instance Throughput Rate set to the default value of Per Second. You can select Per Transaction to show the throughput rate per transaction.
In the example in shown in Figure 4-13, the number of transactions and physical reads per second went up around 12:30 p.m. and remained up until around 5 p.m.
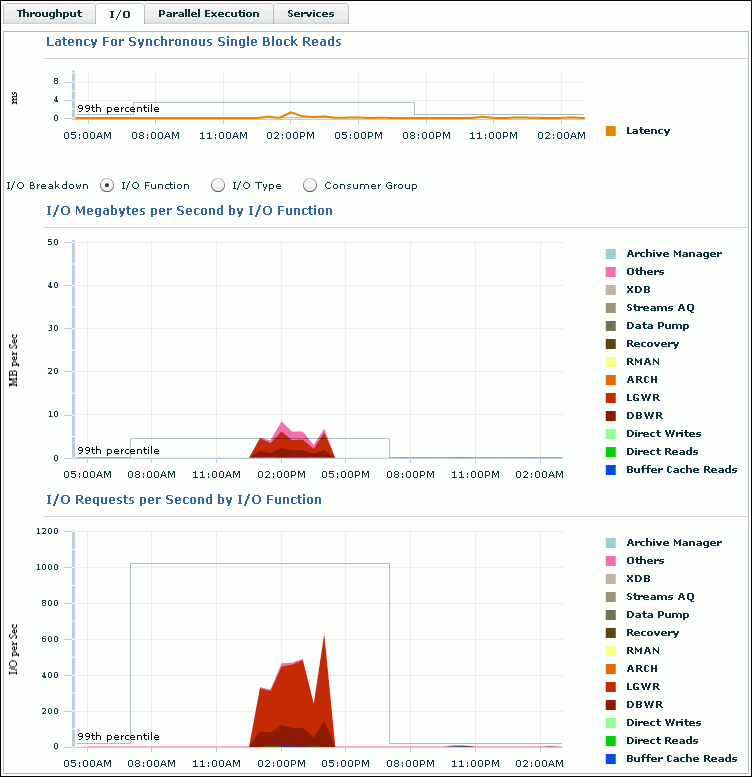
The I/O charts show I/O statistics collected from all database clients. The I/O wait time for a database process represents the amount of time that the process could have been doing useful work if a pending I/O had completed. Oracle Database captures the I/O wait times for all important I/O components in a uniform fashion so that every I/O wait by any Oracle process can be derived from the I/O statistics.
The Latency for Synchronous Single Block Reads chart shows the total perceived I/O latency for a block read, which is the time difference between when an I/O request is submitted and when the first byte of the transfer arrives. Most systems are performing satisfactorily if latency is fewer than 10 milliseconds. This type of I/O request is the best indicator of I/O performance for the following reasons:
Write operations may exhibit good performance because of write caches in storage.
Because multiblock I/O requests have varying sizes, they can take different amounts of time.
The latency of asynchronous I/O requests does not represent the full I/O wait time.
The other charts shown depend on your selection for I/O Breakdown, as described in the following sections:
The I/O Function charts determine I/O usage level by application or job. The component-level statistics give a detailed view of the I/O bandwidth usage, which you can then use in scheduling jobs and I/O provisioning. The component-level statistics fall in the following categories:
Background type
This category includes ARCH, LGWR, and DBWR.
Activity
This category includes XML DB, Streams AQ, Data Pump, Recovery, and RMAN.
I/O type
The category includes the following:
Direct Write
This write is made by a foreground process and is not from the buffer cache.
Direct Read
This read is physical I/O from a data file that bypasses the buffer cache and reads the data block directly into process-private memory.
Buffer Cache Read
Others
This category includes I/Os such as control file I/Os.
To monitor I/O by function:
From the Database Home page, click Performance.
The Performance page appears.
In the instance activity chart, click I/O.
The I/O Megabytes per Second and I/O Requests per Second charts appear.
For I/O Breakdown, select I/O Function.
The I/O Megabytes per Second by I/O Function and I/O Requests per Second by I/O Function charts appear.
The example in Figure 4-14 shows that a significant amount of I/O is being performed by the log writer. The log writer activity peaked at approximately 500 I/O requests per second.
Click the largest block on the chart or its corresponding function in the legend to drill down to the function with the highest I/O rate.
The I/O Details page appears.
You can view real-time or historical data for details on I/O megabytes or I/O requests.
See Also:
Oracle Database Concepts to learn about database background processes such as ARCH, LGWR, and DBWR
The I/O Type charts enable you to monitor I/O by the types of read and write operations. Small I/Os are requests smaller than 128 KB and are typically single database block I/O operations. Large I/Os are requests greater than or equal to 128 KB. Large I/Os are generated by database operations such as table/index scans, direct data loads, backups, restores, and archiving.
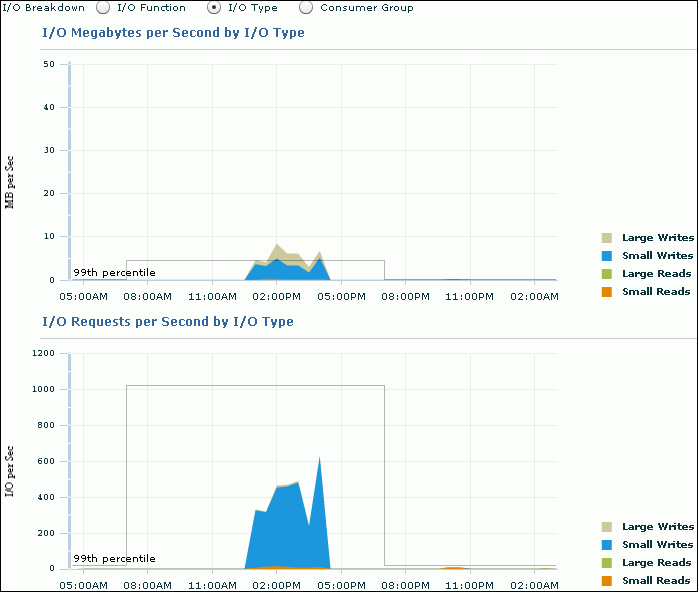
When optimizing for short transaction times, such as in an OLTP environment, monitor latency for small I/Os. High latencies typically indicate that the storage system is a bottleneck.
When optimizing for large queries, such as in a data warehouse, performance depends on the maximum throughput the storage system can achieve rather than the latency of the I/O requests. In this case, monitor the I/O megabytes per second rather than the synchronous single-block I/O latencies.
To monitor I/O by type:
From the Database Home page, click Performance.
The Performance page appears.
In the instance activity chart, click I/O.
The I/O Megabytes per Second and I/O Requests per Second charts appear.
For I/O Breakdown, select I/O Type.
The I/O Megabytes per Second by I/O Type and I/O Requests per Second by I/O Type charts appear.
In this example, the number of small writes per second increased to more than 600. These writes correspond to the log writer I/O requests shown in Figure 4-14.
Click the largest block on the chart or its corresponding function in the legend to drill down to the function with the highest I/O rate.
The I/O Details page appears.
You can view real-time or historical data for details on I/O megabytes or I/O requests.
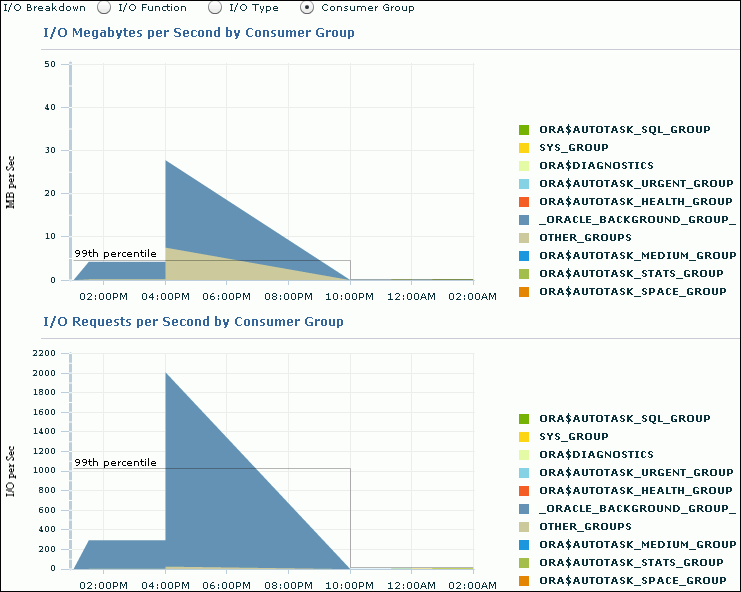
When Oracle Database Resource Manager is enabled, the database collects I/O statistics for all consumer groups that are part of the currently enabled resource plan. The Consumer Group charts enable you to monitor I/O by consumer group.
A resource plan specifies how the resources are to be distributed among various users (resource consumer groups). Resource consumer groups enable you to organize user sessions by resource requirements. Note that the _ORACLE_BACKGROUND_GROUP_ consumer group contains I/O requests issued by background processes.
To monitor I/O requests by consumer group:
From the Database Home page, click Performance.
The Performance page appears.
In the instance activity chart, click I/O.
The I/O Megabytes per Second and I/O Requests per Second charts appear.
For I/O Breakdown, select Consumer Group.
The I/O Megabytes per Second by Consumer Group and I/O Requests per Second by Consumer Group charts appear.
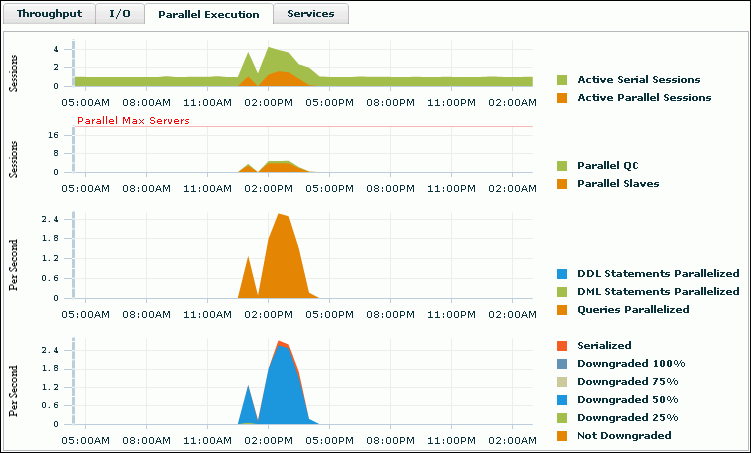
The Parallel Execution charts show system metrics related to parallel queries. Metrics are statistical counts per unit. The unit could be a time measure, such as seconds, or per transaction, or session.
A parallel query divides the work of executing a SQL statement across multiple processes. The charts show parallel queries that were waiting for a particular wait event that accounted for the highest percentages of sampled session activity.
Figure 4-15 Monitoring Parallel Execution
To monitor parallel execution:
From the Database Home page, click Performance.
The Performance page appears.
In the instance activity chart, click Parallel Execution.
The Parallel Execution charts appear.
Two pairs of charts are shown. The first pair shows the number of sessions on the y-axis, whereas the second pair shows the per second rate on the y-axis.
In the example shown in Figure 4-15, query parallelization was active between 12:30 p.m. to 4 p.m.
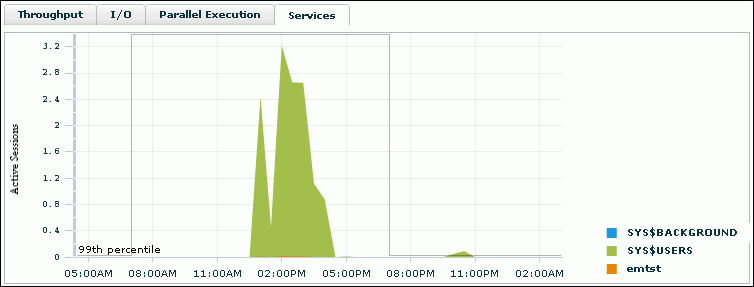
The Services charts show services waiting for the corresponding wait event during the time period shown. Services represent groups of applications with common attributes, service-level thresholds, and priorities. For example, the SYS$USERS service is the default service name used when a user session is established without explicitly identifying its service name. Only active services are shown.
To monitor services:
From the Database Home page, click Performance.
The Performance page appears.
In the instance activity chart, click Services.
The Services chart appears.
In Figure 4-16, the SYS$USERS service has the greatest number of active sessions.
Click the largest block of color on the chart or its corresponding service in the legend to drill down to the service with the highest number of active sessions.
The Service page appears, showing the Activity subpage.
You can view real-time data showing the session load for all wait classes associated with the service.
The Host chart on the Performance page displays utilization information about the system hosting the database.
To determine if the host system has enough resources available to run the database, establish appropriate expectations for the amount of CPU, memory, and disk resources that your system should be using. You can then verify that the database is not consuming too many of these resources.
To view details about CPU, memory, and disk utilization:
From the Database Home page, under Host CPU, click the Load link.
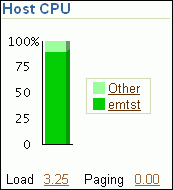
The Host page appears, showing the Performance subpage.
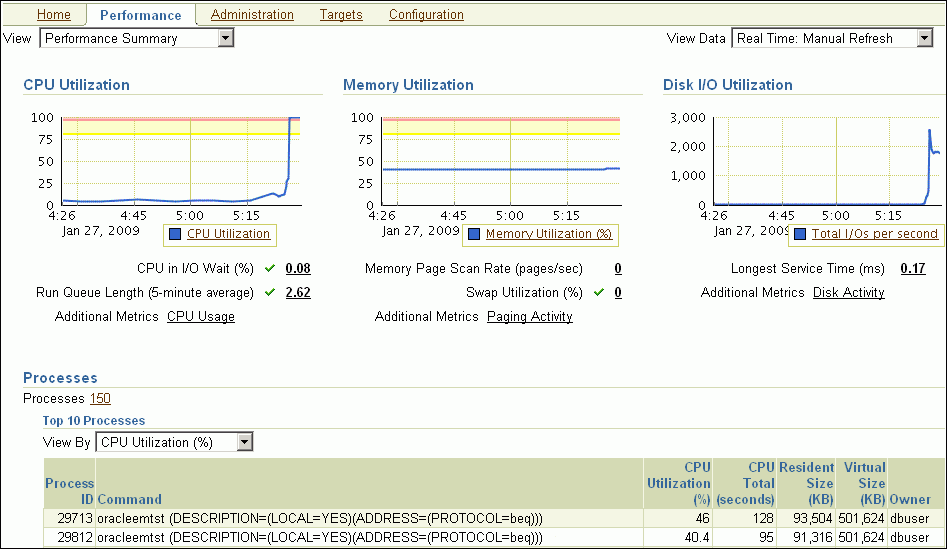
The Performance Summary view is shown by default. The Performance Summary view displays metric values for CPU utilization, memory utilization, disk I/O utilization, and the top 10 processes ordered by both CPU and memory utilization.
Determine whether sufficient resources are available and whether your system is using too many resources.
For example, determine the amount of CPU, memory, and disk resources the database uses in the following scenarios:
When your system is idle, or when little database and nondatabase activity exists
At average workloads
At peak workloads
Workload is an important factor when evaluating the level of resource utilization for your system. During peak workload hours, 90 percent utilization of a resource, such as a CPU with 10 percent idle and waiting time, can be acceptable. However, if your system shows high utilization at normal workload, then there is no room for additional workload.
Perform the following tasks to monitor the host activity for your database:
Set the appropriate threshold values for the performance metrics so the system can automatically generate alerts when these thresholds are exceeded.
For information about setting metric thresholds, see "Setting Metric Thresholds for Performance Alerts".
To address CPU problems, first establish appropriate expectations for the amount of CPU resources your system should be using. You can then determine whether sufficient CPU resources are available and recognize when your system is consuming too many resources. This section describes how to monitor CPU utilization.
From the Database Home page, under Host CPU, click the Load link.
The Host page appears, showing the Performance subpage.
Select CPU Details from the View list.
The CPU Details view appears.
This view contains statistics about CPU utilization, I/O wait times, and load gathered over the last hour. The top 10 processes are listed based on CPU utilization.
Verify the current CPU utilization using the CPU Utilization chart.
The CPU Utilization chart shows CPU utilization over the last hour. The current value is displayed below the chart. During standard workload hours, the value should not exceed the critical threshold.
Click CPU Utilization.
The CPU Utilization page appears.
This page contains CPU utilization statistics and related alerts generated over the last 24 hours.
In the following example, the CPU utilization has suddenly spiked from approximately 6% to 99.86%, which is above the warning threshold of 80%.
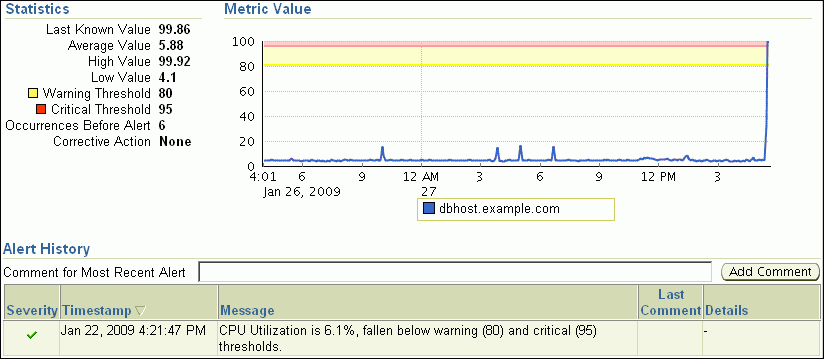
If you notice an unexpected spike in this value that is sustained through normal workload hours, then the CPU performance problem should be investigated.
Verify the current CPU I/O wait time using the CPU I/O Wait chart.
The CPU I/O Wait chart shows CPU I/O wait time over the last hour. The current value is displayed below the chart. During normal workload hours, the value of CPU I/O wait should not exceed the warning threshold.
CPU I/O wait represents the average number of jobs waiting for I/O during an interval.
Click CPU I/O Wait.
The CPU in I/O Wait page appears.
This page contains CPU I/O wait statistics and related alerts generated over the last 24 hours.
If you notice an unexpected increase in this value that is sustained through standard workload hours, then a CPU performance problem may exist.
Verify the current CPU load using the CPU Load chart.
The CPU Load chart shows the CPU load over the last hour. The current value is displayed below the chart. During standard workload hours, the value of CPU load should not exceed the warning threshold.
CPU load represents the average number of processes waiting to be scheduled for CPU resources in the previous minute, or the level of CPU contention time over time.
Click CPU Load.
The Run Queue Length page appears.
This page contains CPU load statistics and related alerts generated over the last 24 hours.
If you notice an unexpected spike in this value that is sustained through normal workload hours, then a CPU performance problem might exist.
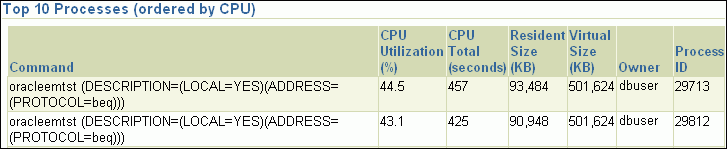
Return to the CPU Details view of the Host Performance subpage and review the Top 10 Processes table.
If a process is consuming too much of the CPU utilization percentage, then this process should be investigated.
In the following example, two database processes are consuming 87.6% of CPU utilization. Therefore, the database is the likely source of a potential CPU performance problem and should be investigated.
If a CPU performance problem is identified, then you can try to resolve the issue by doing the following:
See Also:
Oracle Database Performance Tuning Guide for information about resolving CPU issues
Oracle Database Administrator's Guide for information about Oracle Database Resource Manager
Operating system performance issues commonly involve process management, memory management, and scheduling. This section describes how to monitor memory utilization and identify problems such as paging and swapping.
To monitor memory utilization:
From the Database Home page, under Host CPU, click the Load link.
The Host page appears, showing the Performance subpage.
Select Memory Details from the View list.
The Memory Details view of the Performance subpage appears.
This view contains statistics about memory utilization, page scan rates, and swap utilization gathered over the last hour. The top 10 processes are also listed ordered by memory utilization.
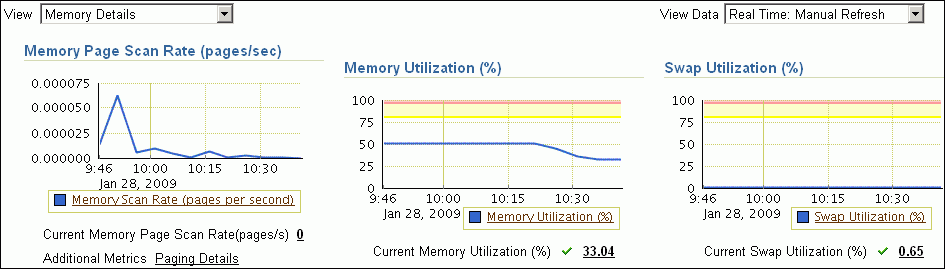
Verify the current memory page scan rate using the Memory Page Scan Rate chart.
The current value of the memory page scan rate is displayed below the chart. On UNIX and Linux, this value represents the number of pages scanned per second. On Microsoft Windows, this value represents the rate at which pages are read from or written to disk to resolve hard page faults. This value is a primary indicator of the kinds of faults that may be causing systemwide delays.
Click Memory Scan Rate.
The Memory Page Scan Rate page appears.
This page contains memory page scan rate statistics and related alerts over the last 24 hours.
If you notice an unexpected increase in this value that is sustained through standard workload hours, then a memory performance problem might exist.
Verify the current memory utilization using the Memory Utilization chart.
The Memory Utilization chart shows how much memory is being used. The current value of memory utilization is displayed below the chart. During standard workload hours, the value should not exceed the warning threshold (shown in yellow).
Click Memory Utilization.
The Memory Utilization page appears.
This page contains memory utilization statistics and related alerts generated over the last 24 hours.
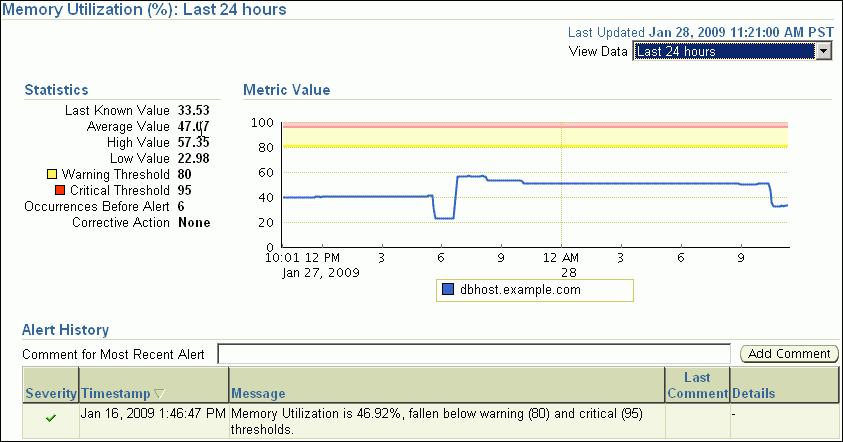
In this example, memory utilization never exceeded 60%, so a warning was not generated.
If you notice an unexpected spike in this value that is sustained through normal workload hours, then a memory performance problem might exist.
Verify current swap utilization using the Swap Utilization chart.
The Swap Utilization chart shows how much swap space is being used. The current value of swap utilization is displayed below the chart. During normal workload hours, the value should not exceed the warning threshold.
Click Swap Utilization.
The Swap Utilization page appears.
This page contains swap utilization statistics and related alerts generated over the last 24 hours.
If you notice an unexpected spike in this value that is sustained through normal workload hours, then a memory performance problem might exist.
Return to the Memory Details view of the Host Performance subpage and review the top processes in the Top 10 Processes (ordered by Memory) table.
If a process is taking up too much memory, then this process should be investigated.
If a memory performance problem is identified, you can attempt to resolve the issue by doing the following:
Use Automatic Memory Management to automatically manage and distribute memory between the System Global Area (SGA) and the aggregate program global area (PGA aggregate).
Use the Memory Advisor to set SGA and PGA memory target values.
Use Automatic PGA Management to manage SQL memory execution.
Avoid running too many processes that consume large amounts of memory.
Reduce paging or swapping.
Reduce the number of open cursors and hard parsing with cursor sharing.
See Also:
Oracle Database Administrator's Guide for information about using Automatic Memory Management
Oracle Database 2 Day DBA for information about using the Memory Advisor
Oracle Database Performance Tuning Guide for information about resolving memory issues
Because the database resides on a set of disks, the performance of the I/O subsystem is very important to database performance. Important disk statistics include the disk I/Os per second and the length of the service times. These statistics show if the disk is performing optimally or if the storage system is being overworked. This section describes how to monitor disk I/O utilization.
To monitor disk I/O utilization:
From the Database Home page, under Host CPU, click the Load link.
The Host page appears, showing the Performance subpage.
Select Disk Details from the View list.
The Disk Details view appears.
This view contains disk I/O utilization and service time statistics gathered over the last hour, and the top disk devices ordered by the percentage of time that they were in use.
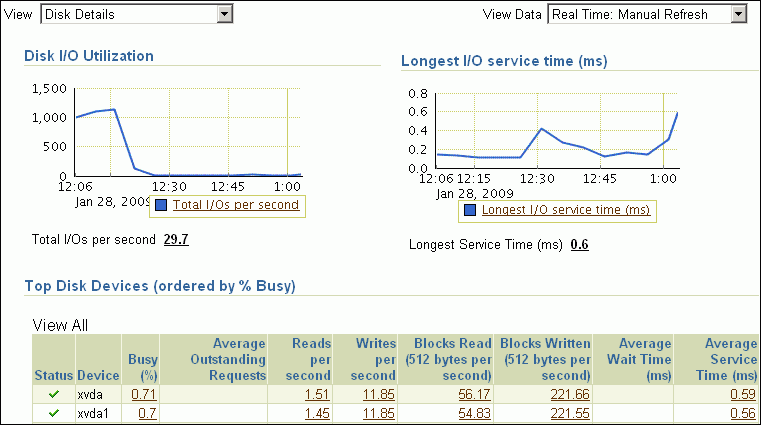
Verify the current disk I/O utilization using the Disk I/O Utilization chart.
The Disk I/O Utilization chart shows how many disk I/Os are being performed per second. The current value for total I/Os per second is displayed below the chart.
Click Total I/Os per Second.
The Total Disk I/O Per Second page appears.
This page contains disk utilization statistics and related alerts generated over the last 24 hours.
If you notice an unexpected spike in this value that is sustained through standard workload hours, then a disk I/O performance problem might exist and should be investigated.
Verify the current I/O service time using the Longest I/O Service Time chart.
The Longest I/O Service Time chart shows the longest service time for disk I/Os in milliseconds. The current value for longest I/O service time is displayed below the chart.
Click Longest I/O Service Time.
The Longest Service Time page appears.
This page contains I/O service time statistics and related alerts generated over the last 24 hours.
If you notice an unexpected spike in this value that is sustained through normal workload hours, then a disk I/O performance problem might exist and should be investigated.
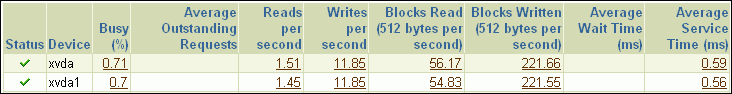
On the Disk Details page, verify the disk devices in the Top Disk Devices table.
If a particular disk is busy a high percentage of the time, then this disk should be investigated.
In this example, the drives that host Oracle Database (xvda and xvda1) are only busy about 1.41 percent of the time, so no disk performance problem appears to exist.
If a disk I/O performance problem is identified, you can attempt to resolve the problem by doing the following:
Use Oracle Automatic Storage Management (Oracle ASM) to manage database storage.
Stripe everything across every disk to distribute I/O.
Move files such as archived redo logs and online redo logs to separate disks.
Store required data in memory to reduce the number of physical I/Os.
See Also:
Oracle Database Performance Tuning Guide for information about resolving disk I/O issues
If you see a spike in database activity in the Performance page, you can access the ASH Analytics page to find out which sessions are consuming the most database time. This page provides a stacked chart to help you visualize the active session activity for several dimensions, such as Event, Activity Class, Module/Action, Session, Instance ID, and PL/SQL function. You can drill down into specific members of a dimension (vertical zooming), and zoom in and out of any time period (horizontal zooming).
From the Performance menu in the database instance, select ASH Analytics.
View a macro perspective of top activity during a selected time period by dragging the shaded area in the top chart to the desired time period.
Tip:
When you move your mouse over the shaded block area, two user controls on both ends of the slider appear that enable you to select the desired time period.You can select a time period within the default setting of one hour, or you can use the selector buttons to display time periods of one day, one week, or one month. You can also use the Calendar and Custom buttons to display a time period other than one of the preset choices.
View a micro perspective of your selected time period by viewing the Activity chart on the page. By default, the chart shows workload activity breakdown values for wait classes.
Investigate the impact by viewing detailed statistics for the top activity sessions that are adversely affecting the system.
Click the largest spike in the chart or the corresponding wait class in the legend beside the chart. The viewer now filters out everything in the chart except for the wait class of interest.
For instance, if the chart shows that the Concurrency wait class has the biggest spike, click the chart area of the legend for Concurrency. The viewer refreshes the chart and now only shows the Concurrency value and displays a Wait Class: Concurrency icon in the Filters bar.
Tip:
You can create an unlimited number of filters.Expand the Activity icon, then select Top Dimensions from the menu, which provides a list of common processes of interest. The chart refreshes in response to your selection, displaying values for the particular category you selected.
For instance, if you create a filter for Concurrency as described above, select Top Dimensions from the menu, then User Session, the chart shows user sessions only for Concurrency.
Optional: Use the Load Map for a graphical view of system activity.
The Load Map is useful for viewing activity in a single- or multi-dimensional layout when you are not interested in seeing how activity has changed over time within the selected period.
Optional: Click Save to save the current page view as an HTML file for offline reference. When you click Save, a pop-up window appears, and you can specify where you want to save the report. This action creates an Enterprise Manager Active Report covering all data currently gathered as part of the analysis. You can use this later to conduct a more thorough postmortem analysis, for instance. You can view the report without Enterprise Manager or database connectivity.
You can also click Mail and specify an email address to send the page as an attachment.
You can customize the Performance page so that it specifically addresses your requirements. As explained in "Monitoring Instance Activity", you can specify which charts you want to appear by default in the Performance page, and how you want them to appear. You can also decide whether to include baseline values in the Throughput and Services charts.
Enterprise Manager stores persistent customization information for each user in the repository. Enterprise Manager retrieves the customization data when you access the Performance page and caches it for the remainder of the browser session until you change the settings.
To customize the Performance page:
From the Database Home page, click Performance.
The Performance page appears.
On the Performance page, click Settings.
The Performance Page Settings page appears.
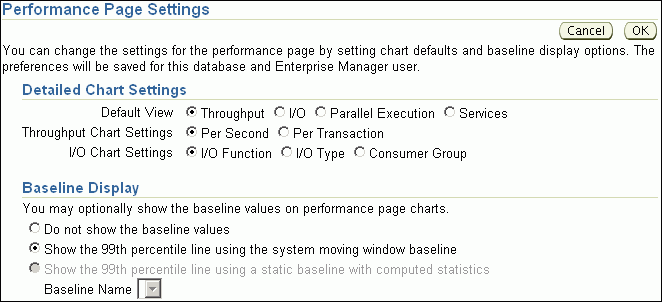
In the Detailed Chart Settings section, choose the defaults for display of the instance activity charts. Complete the following steps:
In Default View, select the instance activity chart to appear by default in the Average Active Session section.
See "Monitoring Instance Activity" for a description of the Throughput, I/O, Parallel Execution, and Services charts.
In Throughput Chart Settings, select Per Second or Per Transaction as the default instance throughput rate to be displayed in the Throughput chart.
See "Monitoring Throughput" to learn how to use the Throughput charts.
In I/O Chart Settings, select the default I/O breakdown to be displayed in the I/O chart.
See "Monitoring I/O" to learn how to use the I/O charts.
In the Baseline Display section, choose how AWR baselines will be displayed in the performance charts. Do one of the following:
Select Do not show the baseline values to prevent baselines from appearing.
Select Show the 99th percentile line using the system moving window baseline to specify a percentile to display for the Throughput and Services charts.
Select Show the 99th percentile line using a static baseline with computed statistics and then select a baseline name from the Baseline Name list.
You can select only baselines that have undergone schedule statistics computation, as described in "Computing Threshold Statistics for Baselines".
Click OK.
The Performance page appears.
The charts are now displayed according to your customized settings.
|
Copyright © 2007, 2011, Oracle and/or its affiliates. All rights reserved. Legal Notices |
|