| Oracle® Warehouse Builder Data Modeling, ETL, and Data Quality Guide 11g Release 2 (11.2) Part Number E10935-05 |
|
|
PDF · Mobi · ePub |
| Oracle® Warehouse Builder Data Modeling, ETL, and Data Quality Guide 11g Release 2 (11.2) Part Number E10935-05 |
|
|
PDF · Mobi · ePub |
The Metadata Dependency Manager enables you to detect and resolve the impact of the changes made to the object definitions or the metadata in the workspace.
This chapter contains the following topics:
The Metadata Dependency Manager provides the interface through which you can explore dependencies among data objects, as represented by the metadata in your Oracle Warehouse Builder repository. The Metadata Dependency Manager presents dependencies in the form of interactive lineage and impact diagrams. A lineage diagram traces the data flows for an object back to the sources and displays all objects along those paths. An impact diagram identifies all the objects that are derived from the selected object.
This type of information can help you in many circumstances such as the following:
Starting from a target object, such as a dimension, cube, or business intelligence tool report, identify the columns in each data source that are used in computing the results in the target.
Assess the impact of design changes in an object such as a source table or a pluggable mapping that is used throughout a project.
Propagate a design change, such as a change to the data type of a source table column, to downstream objects in the design.
Using end-to-end data lineage and impact analysis reduces project risk by enabling better planning for design changes, faster identification of unanticipated impacts when source systems change, and enabling more effective auditing of your business intelligence results, master data or other data integration processes.
The metadata from sources such as files, databases, and applications can change even after the design and implementation of a data integration system. A change in the source metadata implies a corresponding impact in your Oracle Warehouse Builder implementation. Oracle Warehouse Builder enables you to reimport the modified source definitions into the workspace. However, your original warehouse design may no longer remain valid with the reimported definitions, and you must make changes to the design and fix the inconsistencies.
You must first find out how the warehouse design is affected by the changes in the source and then determine all the design objects that are dependent upon the sources. Next, you must synchronize the metadata so that all the affected design objects are updated to reflect the changes in the source. After this process is complete, you can redeploy the updated design to rebuild your data warehouse and synchronize the data.
For example, a company retrieves source data for a data warehouse from a flat file named CUSTOMERS. The CUSTOMERS flat file and a downstream staging table are referenced from multiple mappings in the ETL design, and ultimately loaded into a cube and an instance of Oracle Discoverer used for reporting. Records in CUSTOMERS include a numeric CUSTOMER_ID column, a REGION column which can take values US, EMEA, APAC or OTHER, Records from CUSTOMERS are also fed to a customer master database.
Over time, the following issues arise:
The owners of the customer master data discover that a required column GROUP_ID sometimes contains a NULL value.
The marketing department questions the breakdown of customers and sales by region as shown in reports generated by Oracle Discoverer.
The CUSTOMER_ID column which previously only contained numeric values now may include letters and numbers.
The existing CUSTOMER_NAME column, which was previously 50 characters, is expanded to 100 characters.
A pluggable mapping referenced in several other mappings in the design is updated to reject rows with NULL values for the GROUP_ID column.
Changes to the definition of CUSTOMERS can potentially affect all of the objects downstream of that flat file. Errors in the customer master data could be originating in source data or could be caused by a bug in a ETL mapping. The questions about the Oracle Discoverer reports can be resolved if the origin of the region information for customers can be documented.
Without data lineage and impact analysis based on Oracle Warehouse Builder repository metadata, developers responsible for the changes must manually review the entire data integration design, including staging tables, ODS tables, dimensions, cubes, Discoverer objects and the master data. Design changes in the source data require manual update of any ETL mappings used to load those objects. Marketing's confidence in the BI reports depends upon the developers' through manual review of the design.
The metadata dependency management, data lineage and impact analysis features of Oracle Warehouse Builder simplifies these tasks:
The Metadata Dependency Manager automates tracing the lineage of the bad columns in the customer master data.
The Discoverer design can be validated because the origin of the region data used in the reports is documented and can be proven.
ETL mappings and targets that may be affected by the addition of non-numeric values to the CUSTOMER_ID column can be identified automatically.
Target objects and ETL mappings throughout the design that are affected by the change to the CUSTOMER_NAME column definition can be automatically identified and even updated.
Metadata dependency diagrams show the relationships among objects managed by Oracle Warehouse Builder. The diagrams show both relationships of structure (for example, a primary key and foreign key relationship between columns in two tables) and data relationships (for example, the flow of data from the CUSTOMERS flat file to the CUSTOMERS_STAGE staging table).
Diagrams can be read to discover data lineage and impact analysis information. A diagram can be read from left to right to discover impact analysis information (that is, which objects are affected by a given object or column) or from right to left to discover data lineage information (that is, to identify the source of data in an output object).
For example, you might have a mapping that extracts data from a file and loads it into a table by way of an external table. This is the relationship:
flat_file > external_table > table
Figure 14-1 shows a lineage diagram of an external table named ADDRESS_EXT_TAB. ADDRESS_CSV is a flat file, and it is part of the lineage of ADDRESS_EXT_TAB. Thus, any change to ADDRESS_CSV impacts ADDRESS_EXT_TAB.
Figure 14-1 Lineage Analysis Diagram for ADDRESS_EXT_TABLE
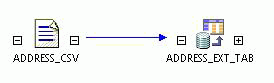
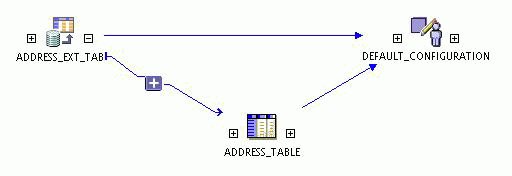
Figure 14-2 shows an impact diagram of ADDRESS_EXT_TAB, which includes the ADDRESS_TABLE. Any change to ADDRESS_EXT_TAB impacts ADDRESS_TABLE. ADDRESS_EXT_TAB is part of the lineage of ADDRESS_TABLE.
Figure 14-2 Impact Analysis Diagram for ADDRESS_EXT_TABLE
Note:
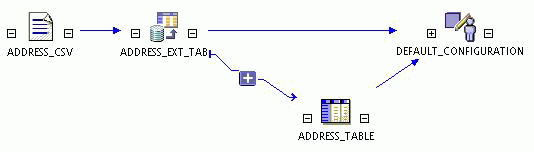
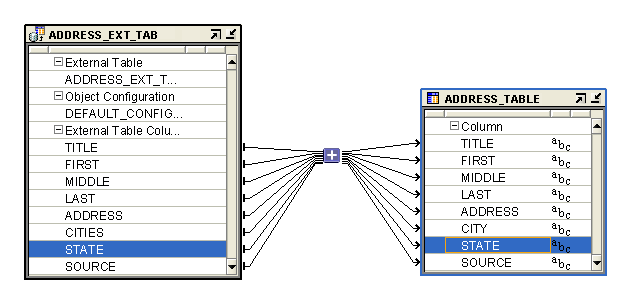
The diagrams include theDEFAULT_CONFIGURATION object and the source and target data objects, because the selected configuration can affect how data is moved from sources to targets.You can expand the diagram to include the lineage and the impact of an object by clicking the plus signs (+) on either side of the object icon in the diagram, as shown in Figure 14-3.
Figure 14-3 Lineage and Impact Analysis Diagram
You can generate an LIA diagram from the Projects Navigator in the Design Center.
To generate an LIA diagram from the Design Center:
Expand the Projects Navigator until you see the object to analyze.
Right-click the object and select Lineage or Impact.
The Lineage or Impact tab is displayed, showing either the lineage of the object (one level of objects to the left of the selected object) or its impacts (one level of objects to the right of the selected object).
The Lineage and Impact commands are also available from the View menu.
Your initial selection of an object and a diagram type simply determine the initial starting point and the direction that the diagram branches from that object. You can modify an LIA diagram in the following ways:
Drag-and-drop another object onto the diagram to view its dependencies along with the other objects.
Click the plus (+) and minus (-) signs next to an object icon to expand or collapse a branch of the diagram.
Remove the selected objects from the canvas. From the Graph menu, select Hide Selected Object to remove objects from the canvas. To restore the hidden objects, select Refresh from the Graph menu.
Use the grouping tool to collapse a section of the diagram into a single icon, as described in "Using Groups in an LIA Diagram".
Double-click an object to display its attributes, as described in "Displaying an Object's Attributes".
Right-click an object to display the following menu options: Open Editor, Show Full Lineage, and Show Full Impact.
"Making Changes to Design Metadata Using Automatic Change Propagation" describes the Open Editor option.
The Show Full Lineage and Show Full Impact options are described "Exploring Object Lineage and Impact in an LIA Diagram".
Use the following options in the Graph menu to explore the lineage and impact analysis information in LIA diagrams:
Show Full Impact: Expands nodes to show all impacts in the diagram of the selected object.
Show Full Lineage: Generates the full lineage diagram of the selected object.
Show Lineage: Displays the next level of objects in the lineage diagram of the selected object.
Hide Lineage: Hides the lineage of the selected object.
Show Impact: Displays the next level of objects in the impact diagram of the selected object.
Hide Impact: Hides all impacts of the selected object.
You can search for objects in the lineage and impact analysis diagram, as with other editors within Oracle Warehouse Builder. Searching forward follows the impact analysis from left to right, and searching backward follows the data lineage from right to left. The diagram moves so that the current matching node is at the center of the diagram. You can also highlight all matches for a search in the diagram.
To search within a Lineage and Impact Analysis (LIA) diagram:
From the Search menu, select Find.
The Find dialog box is displayed.
In the Find field, enter the name of the object you want to find.
To use additional options while searching for objects, click Show Advanced.
The advanced search options are displayed in the Find dialog box.
(Optional) Specify advanced search options as described in the following sections:
These sections discuss performing advanced search for mappings and pluggable mappings. However, the functionality and the processes are the same when you perform advanced search in an LIA diagram.
Click OK.
Groups enable you to organize the objects in a complex diagram so that they are easier to locate and edit. By reducing the number of objects in a diagram, you can more easily focus on the objects currently of interest.
Select a group of objects by dragging and dropping a box around them.
Click Group Selected Objects on the toolbar.
The Group Selected Data Objects dialog box is displayed.
Enter a name for the group.
The selected objects are collapsed into a single folder icon.
To display the individual objects in a group, double-click the folder icon. You can work on these objects in the same way as ungrouped objects.
To ungroup the objects, select the group and click Ungroup Selected Object on the toolbar.
The following operations are available for working with groups in an LIA diagram.
Group Selected Objects: Creates a group containing the selected objects on the canvas. A folder icon represents all objects in the group. Grouping enables you to reduce clutter on the canvas when there are many objects. Double-click the icon to display the individual objects in the group.
Ungroup Selected Objects: Eliminates the selected group so that all objects are represented individually. Select the folder icon you want to ungroup and click Ungroup Selected Folders.
Group By Module: Automatically groups all objects by module. A folder icon represents the module and all objects in the module. To group by module, select Group By Module from the Graph menu.
Double-click the icon to display the individual objects in the group.
Ungroup Modules: Eliminates the module groups so that all objects are represented individually. To ungroup modules, select Ungroup Modules from the Graph menu.
You can expand an object icon in a diagram so that you can examine its attributes. To expand an icon, double-click it. To reduce it to an icon, click the down arrow in the upper-right corner.
To generate an LIA diagram for an attribute:
Generate an LIA diagram for an object.
Double-click the icons to display their attributes.
Right-click an attribute and select Show Lineage or Show Impact.
The attributes along the lineage or impact path for the selected attribute are highlighted in a different color.
You can use this detailed information for auditing or when planning to propagate changes.
Figure 14-4 shows two expanded icons whose column attributes are connected by a mapping.
Figure 14-4 Expanded Icons in an LIA Diagram
LIA diagrams can be exported to SVG or JPEG formats, or printed using commands under the File menu.
Export Diagram: Exports the active diagram to the local file system as an SVG or JPEG file. To export an LIA diagram, select Export, then Diagram from the File menu.
Print Options: Provides Print Setup, Preview, and Print options for printing the diagram.
The LIA diagrams identify all of the objects that may be invalidated by a change to one or more objects. With this knowledge, you can examine the affected objects and modify them as necessary. Many changes can automatically be propagated to downstream objects in the Metadata Dependency Manager.
In the Dependency Manager, navigate to the first object to be changed. For example, navigate to a source table.
Right-click the object icon in a diagram and select Open Editor.
Oracle Warehouse Builder opens the editing tool for the object. For example, if you selected a table, then Oracle Warehouse Builder opens the Data Object Editor.
Make the necessary changes in the editing tool and then save your changes.
Repeat these steps for all objects identified in the LIA diagram as needing change.
In the case that only a few objects are affected by a change, then you may prefer to modify the object manually. However, if many objects are affected, you can use automated change propagation to save time.
To propagate metadata changes using Dependency Manager:
Double-click the object icon in a diagram.
For example, double-click the icon for a source table.
Right-click the metadata to change, and select Propagate Change.
For example, right-click a column in the table.
Change the attributes as described in "Automated Change Propagation in the Dependency Manager".
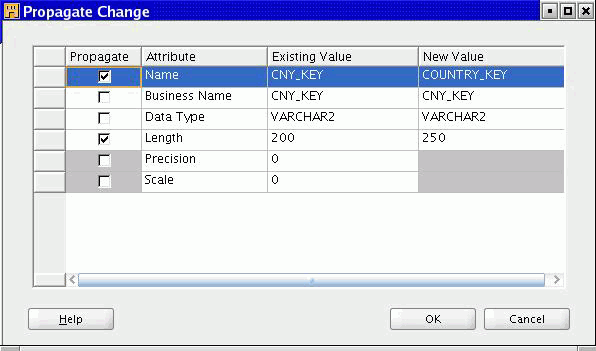
In the Propagate Change dialog box, you specify metadata changes which Oracle Warehouse Builder propagates to all dependent objects, as indicated in the Lineage Impact Analysis diagram. This dialog box displays metadata details under the following columns: Propagate, Attribute, Existing Value, and New Value.
Figure 14-5 displays the Propagate change dialog box.
The Attribute column lists the metadata attribute, such as name, business name, and data type. The Existing Value column lists the current value of the attribute and the New Value lists the changed value discovered by the Metadata Dependency Manager.
Select Propagate for each attribute to change. For example, to change the data type and length for a column, ensure that you select Propagate to the left of these attributes.
In the New Value field, you can enter the desired values for each attribute. Click OK after selecting the changes to propagate.
|
Copyright © 2000, 2011, Oracle and/or its affiliates. All rights reserved. Legal Notices |
|