| Oracle® Communications Data Model Reference Release 11.3.1 Part Number E28440-03 |
|
|
PDF · Mobi · ePub |
| Oracle® Communications Data Model Reference Release 11.3.1 Part Number E28440-03 |
|
|
PDF · Mobi · ePub |
This chapter provides Oracle Communications Data Model sample reports.
Note:
Some of the reports shown may appear incomplete. The sample reports shown use manually generated data, and for data privacy and regulatory reasons, it shows only made up customers (with real data). Hence, if you notice data inconsistency between the reports, this is not due to Oracle Communications Data Model, but due to the sample data.The reports shown in this chapter appear as shown when you install Oracle Communications Data Model with the sample data.
This chapter includes the following sections:
The cost and contribution sample reports include the following areas: Operational Finance Analysis and Profitability Analysis.
This area includes the following:
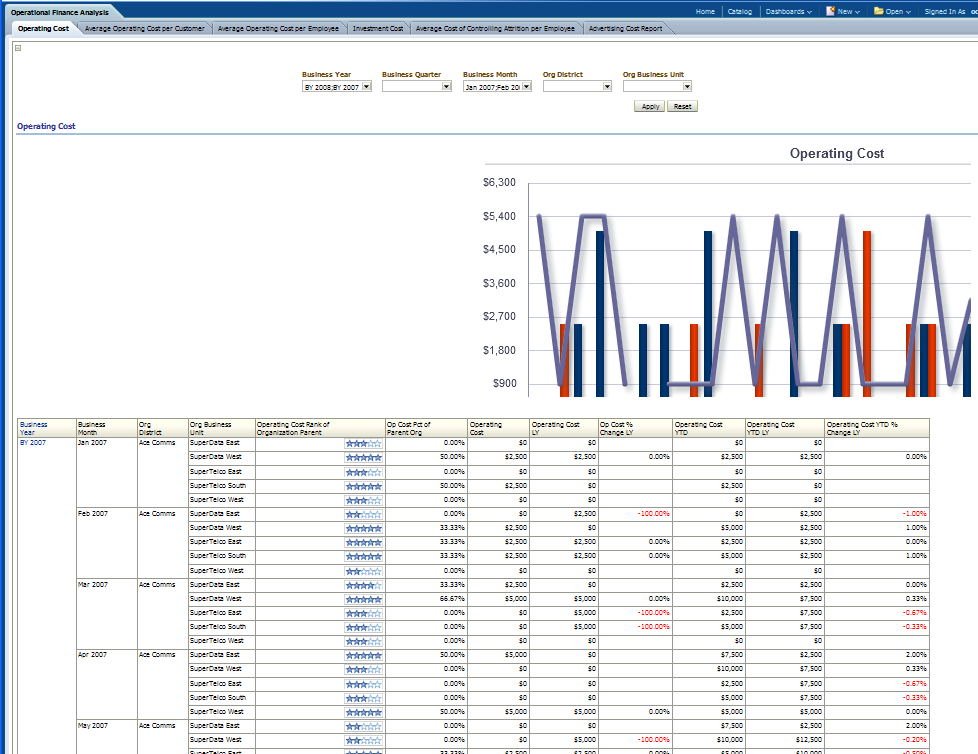
This area includes the reports: Operating Cost, Average Operating Cost per Customer, Average operating Cost per Employee, Investment Cost, Average Cost of Controlling Attrition per Employee, and Advertising Cost Report.
This report, as shown in Figure 12-1 provides the current year month-level "Operating Cost" information for each organization business unit. It also ranks all organization business units according to their cost in their parent "Organization". The end user can compare the cost with last years metrics such as: LY, % Change LY, YTD, YTD LY, YTD % Change LY.
Report dimensions are:
Business Time
Organization
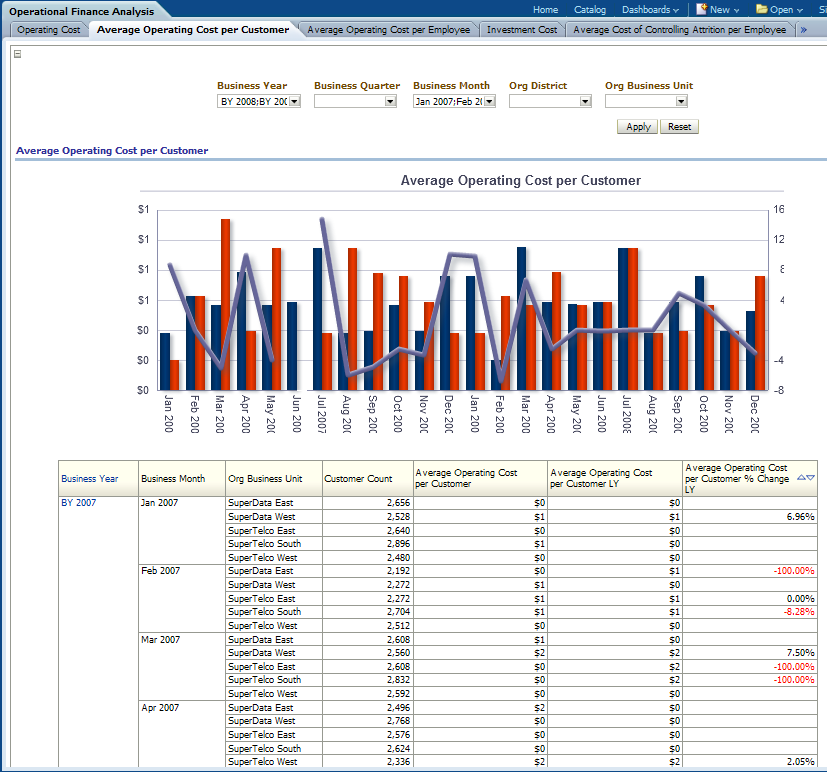
This report, as shown in Figure 12-2 provides the current year month-level "Average Operating Cost per Customer" information based on "Organization Unit" which can be compared with last years metrics like LY, % Change LY.
Report dimensions are:
Business Time
Organization
Figure 12-2 Average Operating Cost per Customer Sample Report
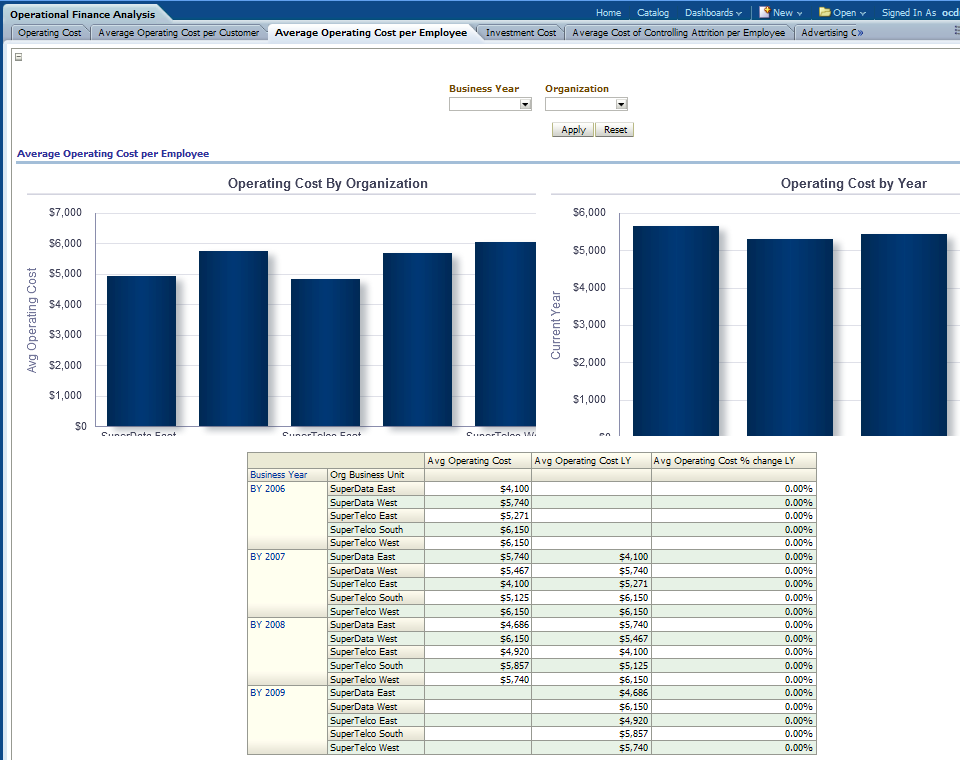
This report, as shown in Figure 12-3 provides the current year "Average Operating Cost per Employee" information based on "Organization Business Unit" which can be compared with last years metrics such as: LY, % Change LY.
Report dimensions are:
Business Time
Organization
Figure 12-3 Cost: Average Operating Cost per Employee
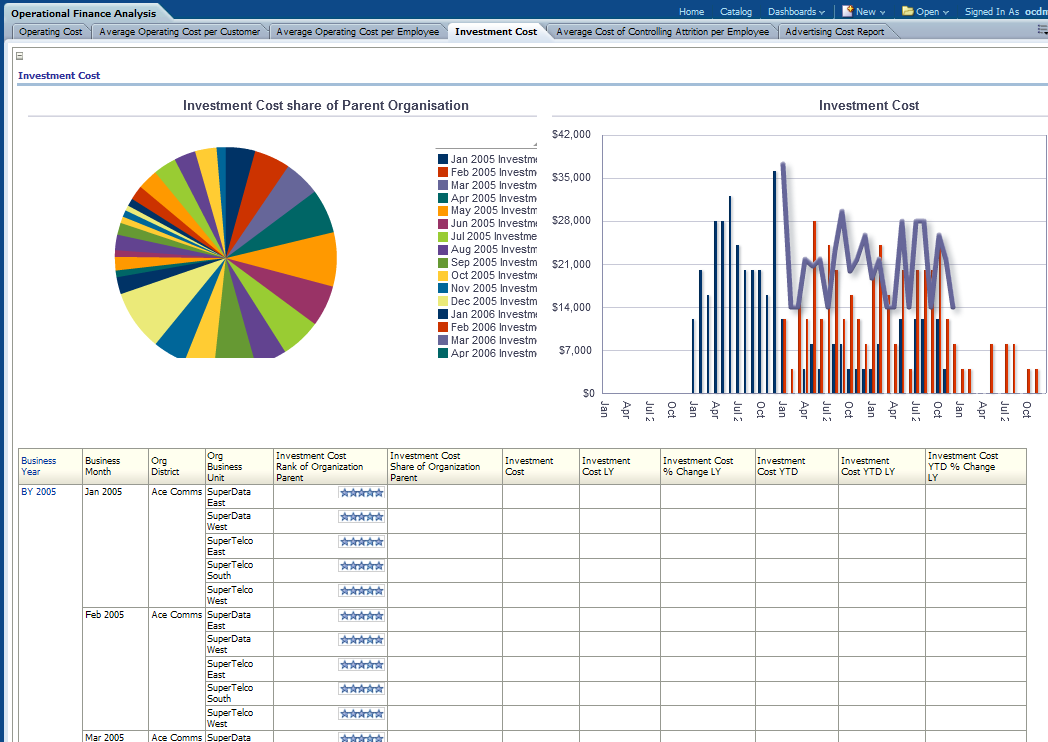
This report, as shown in Figure 12-4 provides the current year month-level "Investment Cost" and "Investment Cost share of parent Organization" information based on "Organization Unit and district" which can be compared with last years metrics like LY, % Change LY, YTD, YTD LY and YTD % Change LY.
Report dimensions are:
Business Time
Organization
Figure 12-4 Investment Cost Sample Report
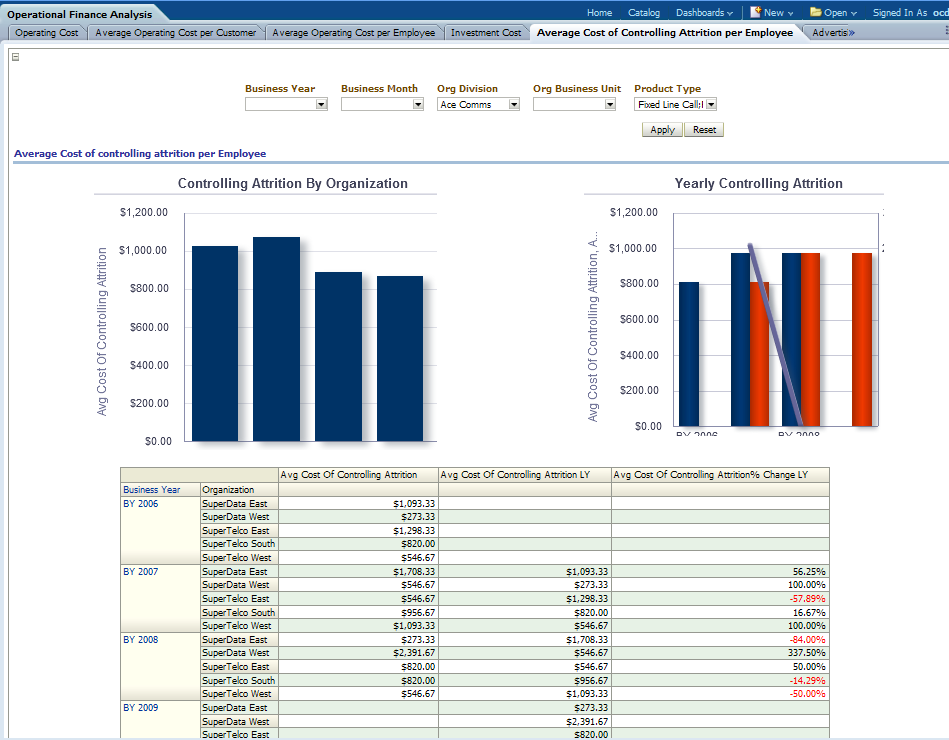
This report, as shown in Figure 12-5 provides the current year Level "Controlling Attribution by organization" and "Yearly Controlling Attribution" information based on "Organization" which can be compared with last years metrics like LY and % Change LY.
The attrition cost should be defined by the service operator.
Report dimensions are:
Business Time
Organization
Product
Figure 12-5 Average Cost of Controlling Attrition per Employee
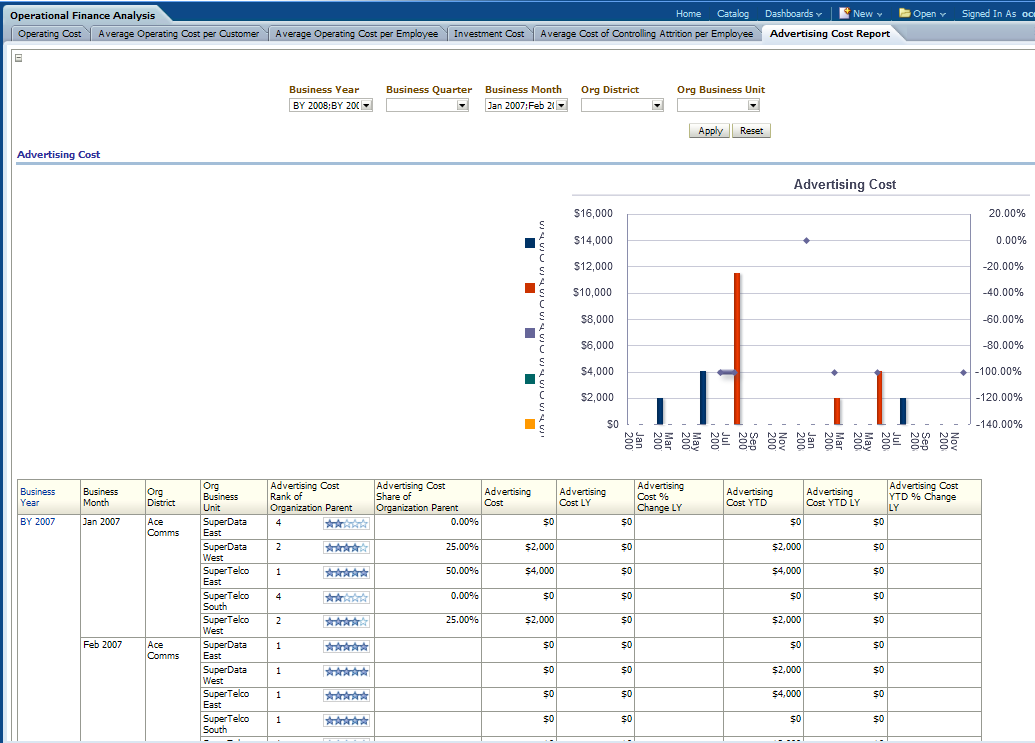
This report, as shown in Figure 12-6 provides the current year month-level "Advertising Cost" information based on "Organization Parent" which internally can be compared with last years metrics like LY,% Change LY, YTD, YTD LY, YTD % Change LY.
Report dimensions are:
Business Time
Organization
Figure 12-6 Advertising Cost Report Sample Report
This area includes the reports: Total Profit, Average Profit per Customer, Average Profit per Employee, and Inventory Out-of-Stock (Handset Model).
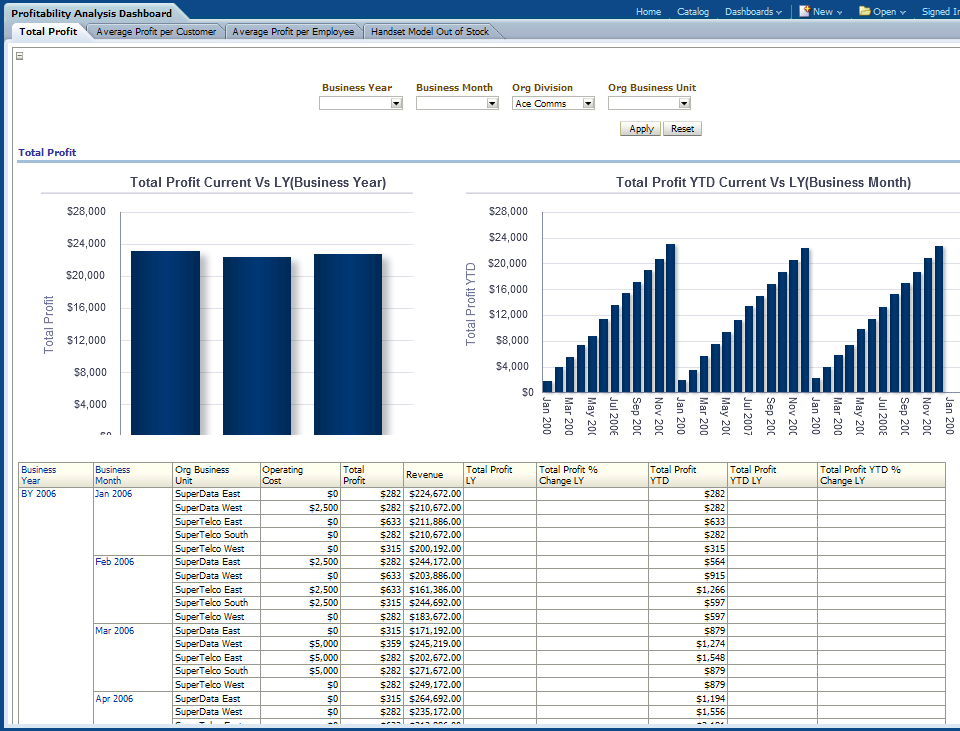
This report, as shown in Figure 12-7 provides the current year and month-level "Total Profit" information based on "Organization" which internally can be compared with last years metrics like LY,% Change LY, YTD, YTD LY, YTD % Change LY.
Report dimensions are:
Business Time
Organization
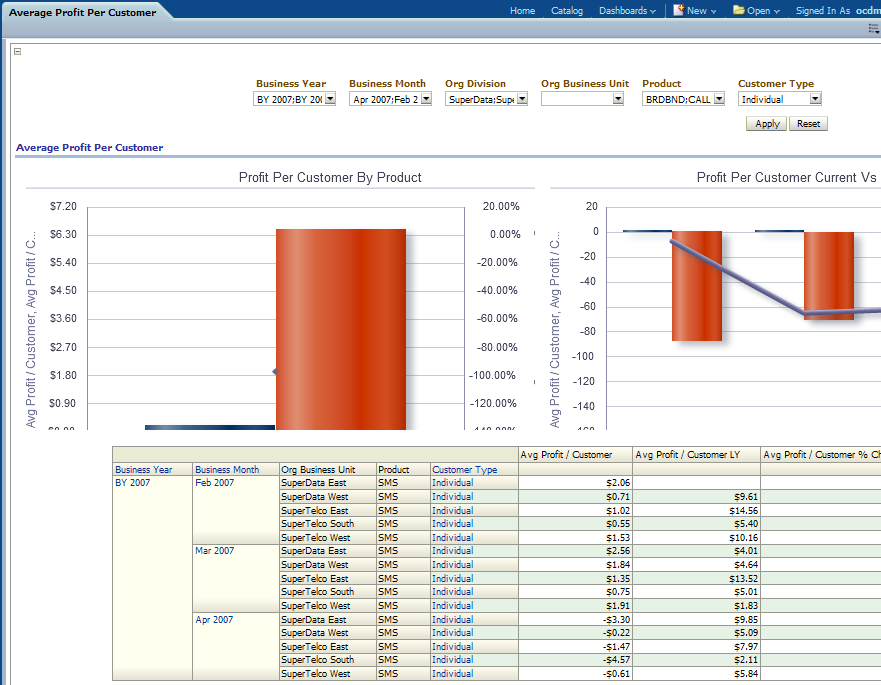
This report, as shown in Figure 12-8 provides the current year and month-level "Average Profit" information based on "Customer" and "Customer by Product" which internally can be compared with metrics such as LY, % Change LY for last year.
Report dimensions are:
Business Time
Organization
Product
Customer Type
Figure 12-8 Profit: Average Profit per Customer Sample Report

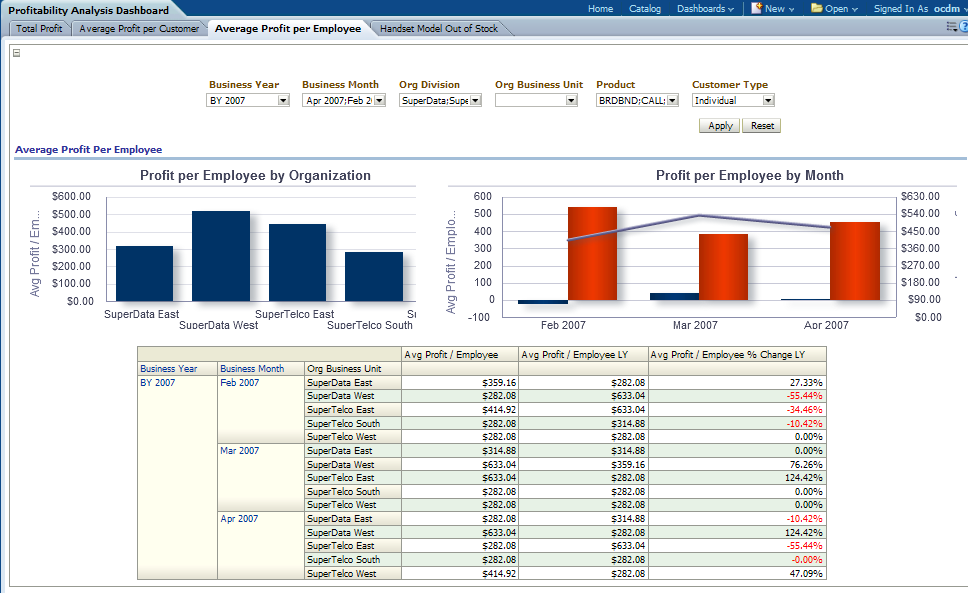
This report, as shown in Figure 12-9 provides the current year and month-level "Average Profit" information based on "Employee" and "Org Business Unit" which can be compared with last years metrics like LY, % Change LY.
The average profit is calculated by dividing the total profit by the number of employees.
Report dimensions are:
Business Time
Organization
Product
Customer Type
Figure 12-9 Profit: Average Profit per Employee Sample Report
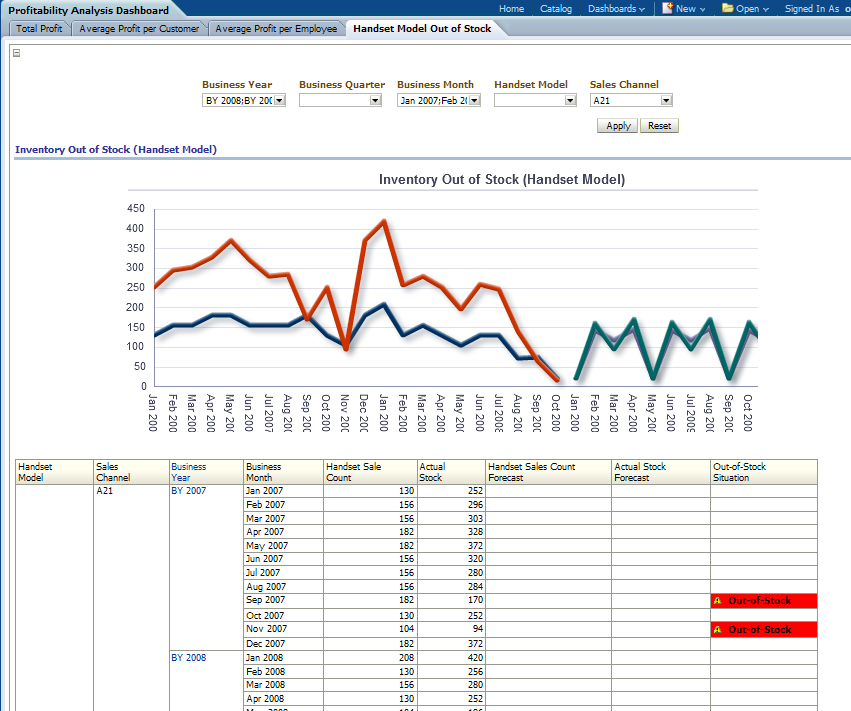
This report, as shown in Figure 12-10, provides the information related to the Handset Model for Current Year and Current Month like average handset stock sold stock in hand, handset sales forecasting, actual stock forecasting and information relating to handset out of stock situation.
By comparing the actual handset stock level to the forecast handset sales, you can identify some time point when the actual handset stock may be lower than the expected Sales number. This situation is called Out of Stock and may lead to revenue loss.
Report dimensions are:
Business Time
Organization
Sales Channel
Handset Model
Figure 12-10 Inventory Out-of-Stock (Handset Model) Sample Report
The customer management sample reports include the following areas:
This area includes the reports: Customer Acquisition, and Customer Acquisition Forecast.
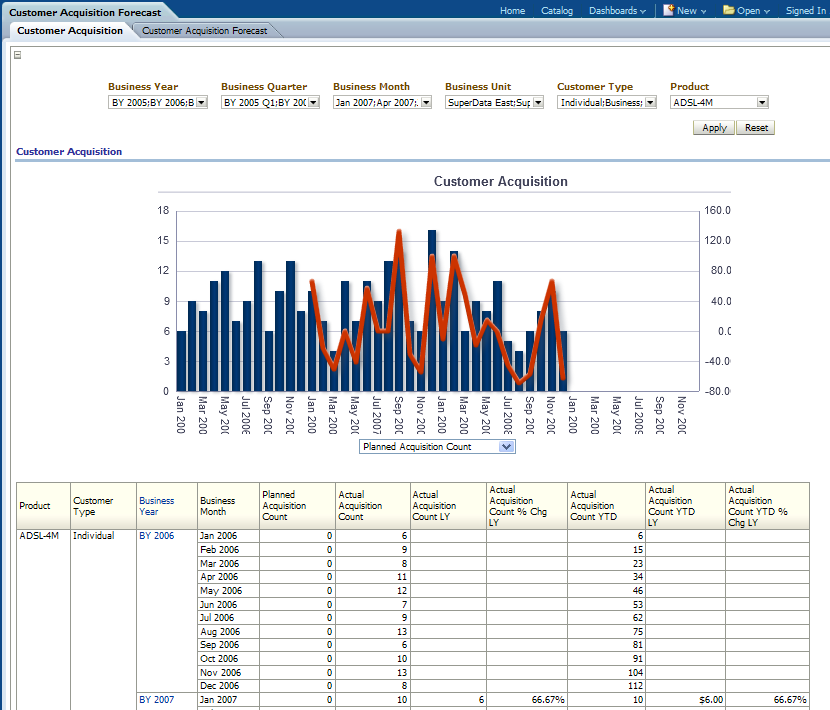
This report, as shown in Figure 12-11 provides the yearly and monthly number of customers to be acquired compared with actual customers acquired by product and with respective to customers type. All time transformation variation of Customer Acquisition numbers are displayed, including Last Year (LY) and Year to Date (YTD). Users can select certain products, organizations, and customer's type to narrow down the customer numbers
Report dimensions are:
Business Time
Product
Customer
Figure 12-11 Customer Acquisition Sample Report
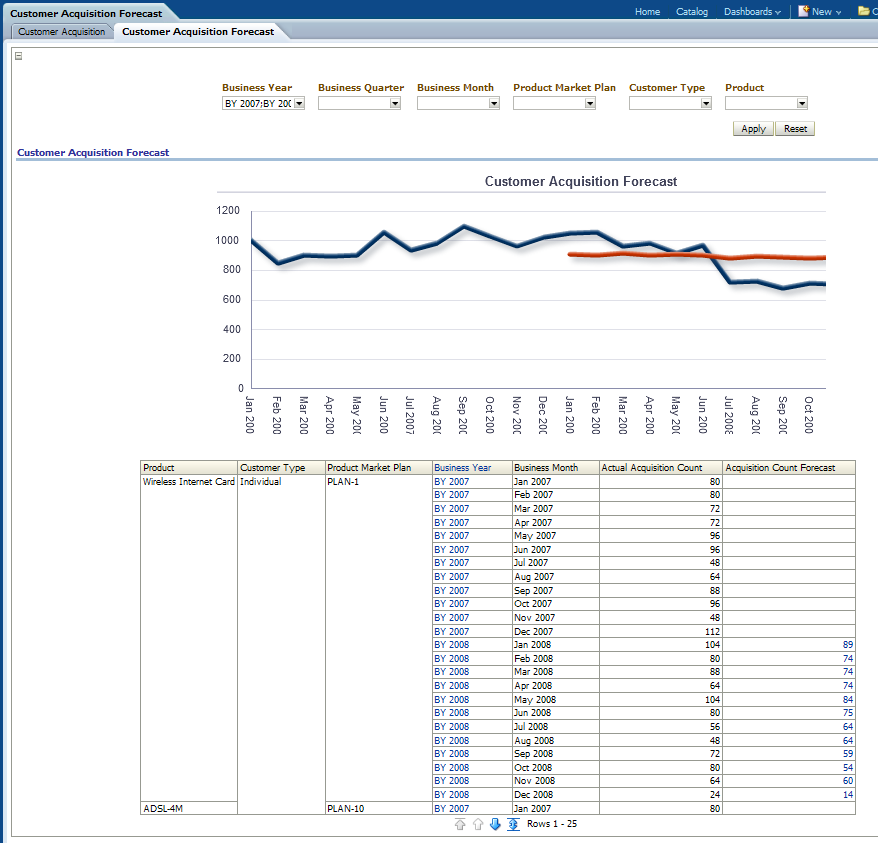
This report, as shown in Figure 12-12 provides the yearly and monthly level forecasting of customers count to be acquired versus the actual customers acquired by product market plan and customers type.
Report dimensions are:
Business Time
Product
Customer Type
Product Market Plan
Figure 12-12 Customer Acquisition Forecast Sample Report
This area includes the reports: Customer Growth Rate and Customer Growth Trend Forecast.
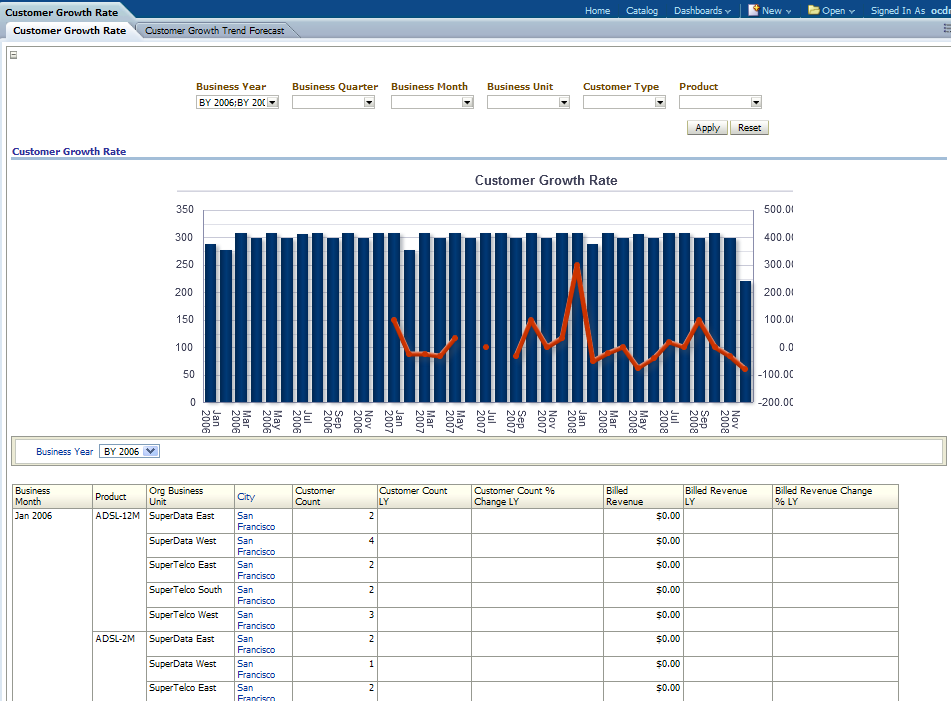
This report, as shown in Figure 12-13 provides the yearly and monthly customer count and revenue growth rate over products and geographical boundaries
Report dimensions are:
Business Time
Organization
Product
Geography
Figure 12-13 Customer Growth Rate Sample Report
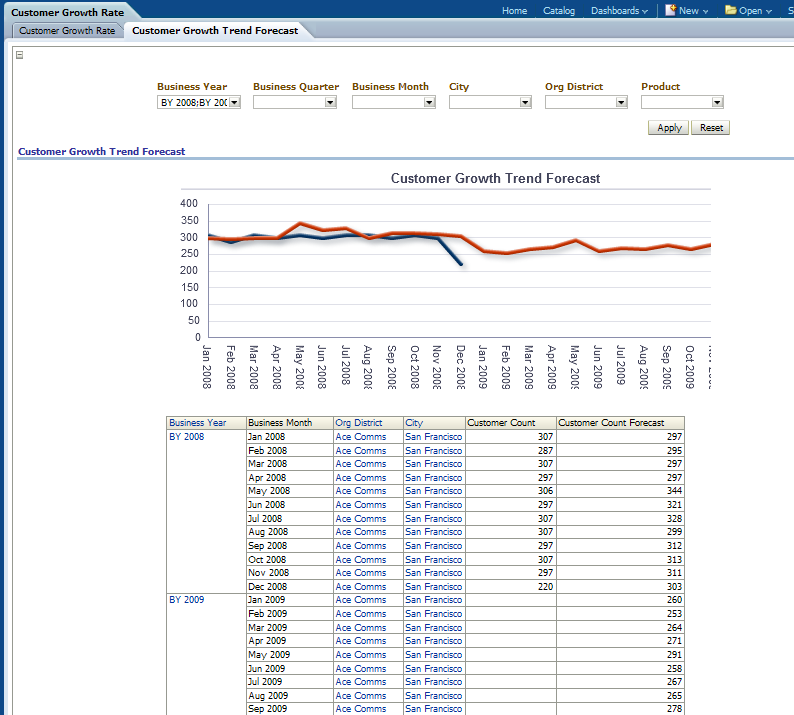
This report as shown in Figure 12-14 provides the month level number of customers for organization, products, and geographical boundaries. The future number of customers forecast for the next six months, or twelve months, can be forecast by Oracle OLAP forecast settings.
Report dimensions are:
Business Time
Organization
Product
Geography
Figure 12-14 Customer Growth Trend Forecast Sample Report
This area includes the reports: Customer Segments and Customer Segmentation Details.
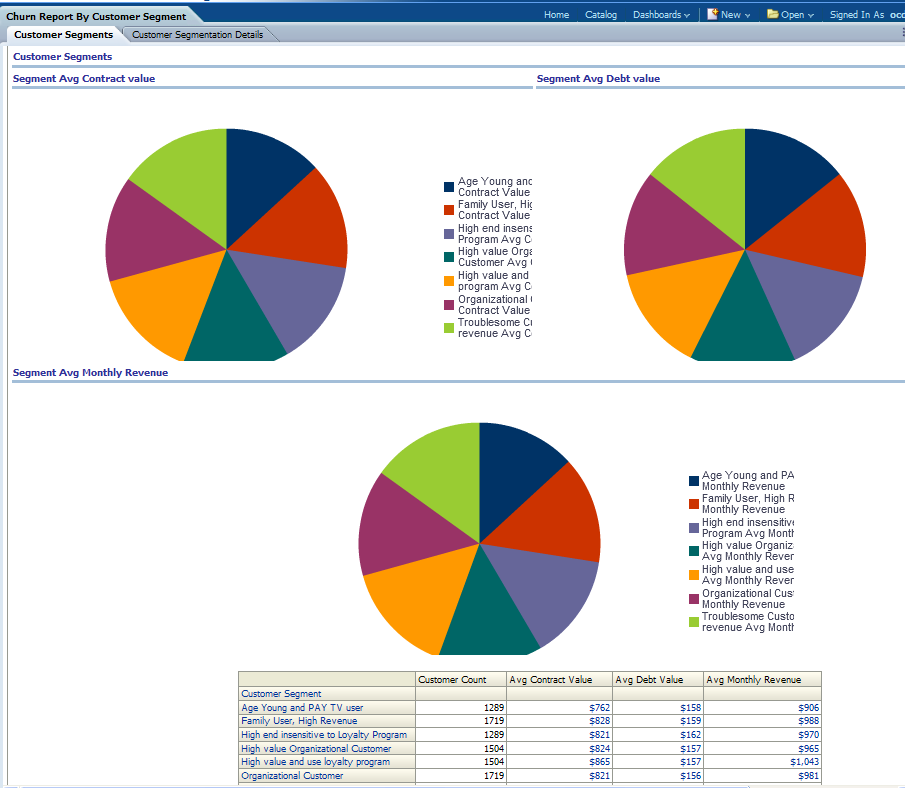
This report, as shown in Figure 12-15 shows customer segments.
This report displays the customer segmentation model result. The customer segmentation model groups customers into ten segments according to how similar they are to each other. The similarity is calculated based on customer demographic value (education, income, and so on), usage pattern and list of telecom products they subscribe to (customer subscriber history). The grouping rules are derived automatically by K-Means algorithm implemented inside Oracle Database. Business Analysts can look into each segment to further understand the customer group discovered by the algorithm and name each segments.
By default, the summary information about each segment is displayed in the bottom table. For each segment, the Average Contract Value, Avg Debt Value, and Avg monthly revenue (in last 6 months) are displayed. Those three values are depicted in three pie charts above the table respectively, to show the distribution among customer segments.
The prompt "SVM Predict Churner Indicator" can be used to filter the customer. If user select "1", then for each segment, only those customer who were predicted as "churner" by SVM churn model is counted in. Then the number would be less than all customers in the segment.
Similarly, "DT Predict Churner Indicator" can filter customers to be only those who were predicted as "churner" by Decision Tree churn model
Note: This groups all the customers, not only churners.
Report dimensions are:
Customer
Figure 12-15 Customer Segments Sample Report
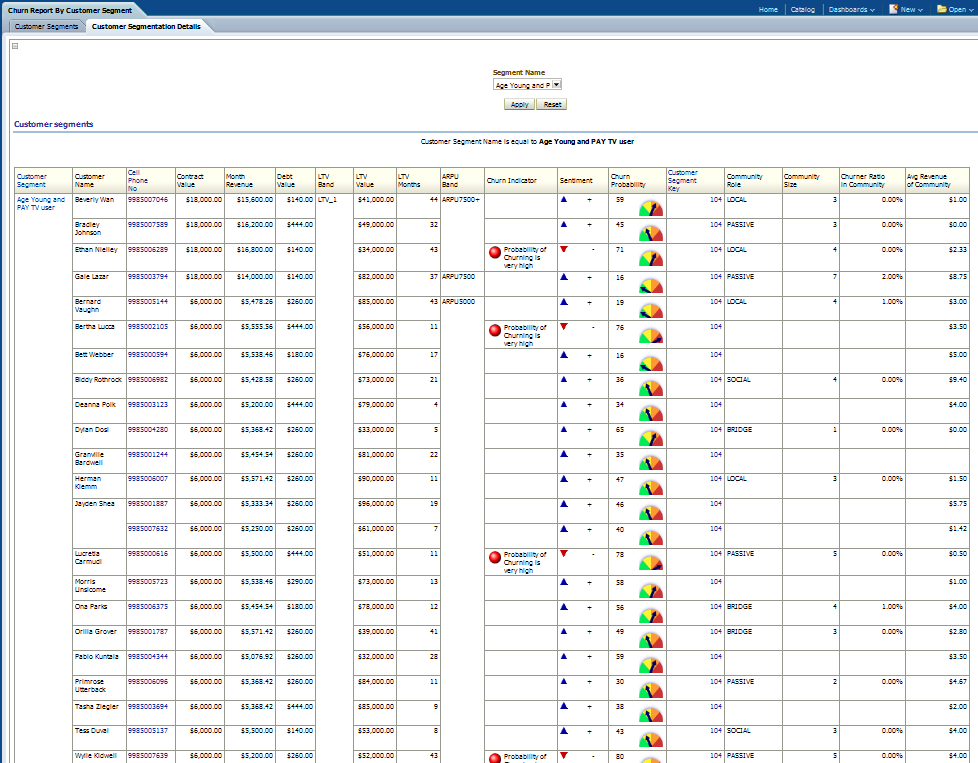
This report, as shown in Figure 12-16 provides the customer segmentation details on basis of certain customer statistical metrics such as contract value, month revenue, debt value and so on.
For the given customer, the report also displays the contract value, month revenue, debt value and so on. In fact, the end user can easily extend this report by adding any relational aggregated information about the customer into this report. For example, number of calls, number of complaints, and so on. They can use BIEE Answers to add those additional measures into the report.
Report dimensions are:
Customer
Figure 12-16 Customer Segmentation Details Sample Report
This area includes the reports: Customer Life Time Value, Customer by Life Time Value Band, Customer by Life Time Span Category, and Customer Life Time Span Detail.
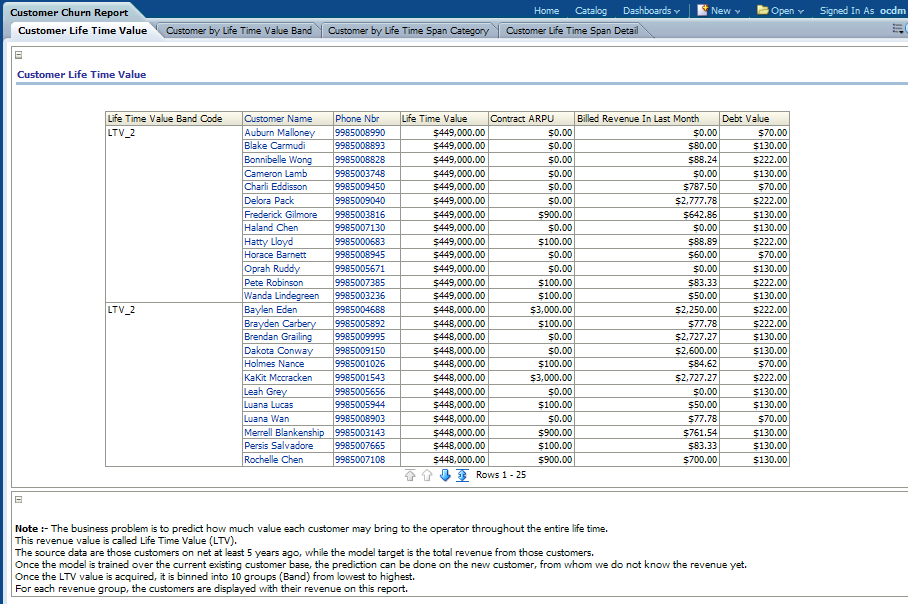
This report as shown in Figure 12-17 provides the predicted Life Time Value (LTV) for all customers grouped by LTV Band Code. It also shows some additional aggregated information about the customer.
Report dimensions are:
Customer
Customer Mining
Figure 12-17 Customer Life Time Value Sample Report
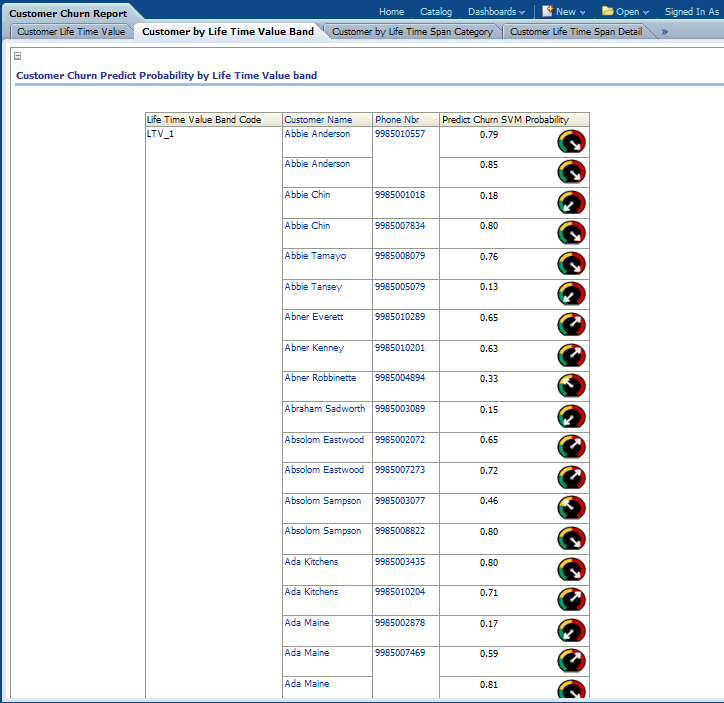
This report, as shown in Figure 12-18 provides the churn prediction result for the customers belonging to a certain Life time Value Band (that is, the customers likely to be with the service provider compared with the customers that already left the service provider.)
Report dimensions are:
Customer
Customer Mining
Figure 12-18 Customer by Life Time Value Band Sample Report
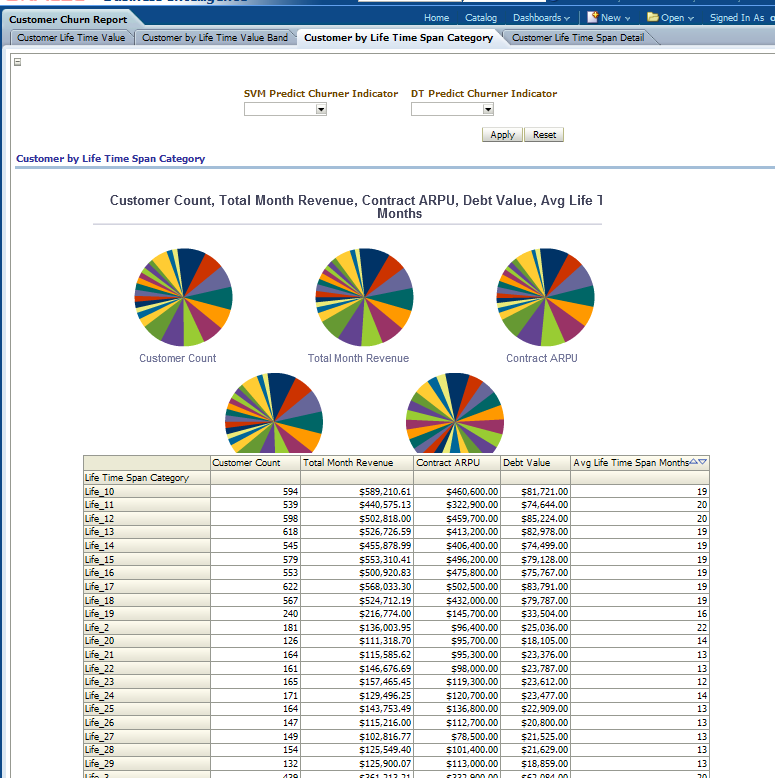
This report, as shown in Figure 12-19 provides the customer life time span with the service provider on the basis of certain mining metrics such as average life time span months, total month revenue, contract Average Revenue Per User (ARPU) and so on. The Life time span value is measured by Months, therefore, a value of "22" in "Avg Life Time Span Months" means the customer is very likely to use the services for at least 22 months. The customers are binned into Life Time Span Category according to the value of Life time span.
Report dimensions are:
Customer
Customer Mining
Figure 12-19 Customer by Life Time Span Category Sample Report
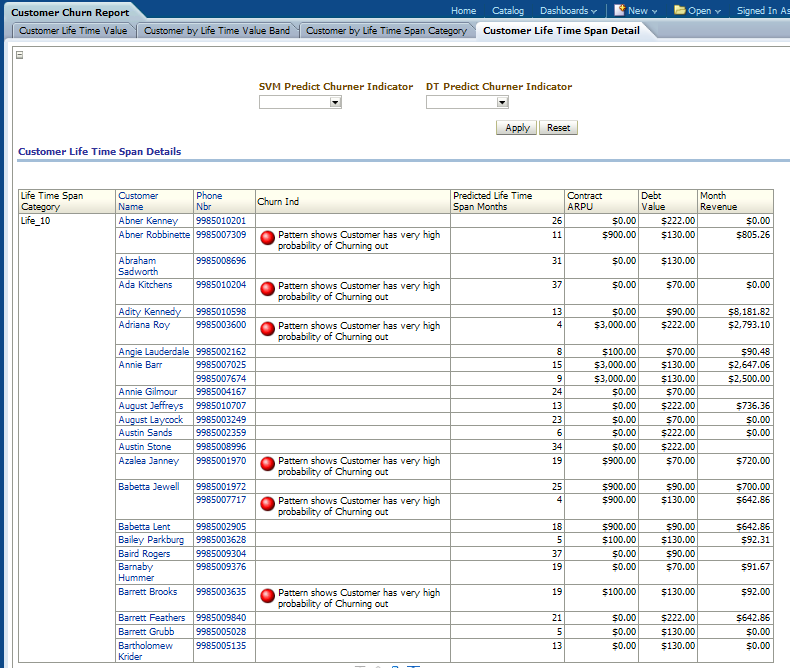
This report, as shown in Figure 12-20 provides more information about the customers in each life time span category than report "Customer by Life Time Span Category".
Report dimensions are:
Customer
Customer Mining
Figure 12-20 Customer Life Time Span Detail Sample Report
This area includes the reports: Customer Churn Rate, Customer Churn Statistics, Churn Reason Distribution, Churn Outlier by Site (Building), Churn Outlier by Sales Agent, and Complain Rate Outlier by Business Unit.
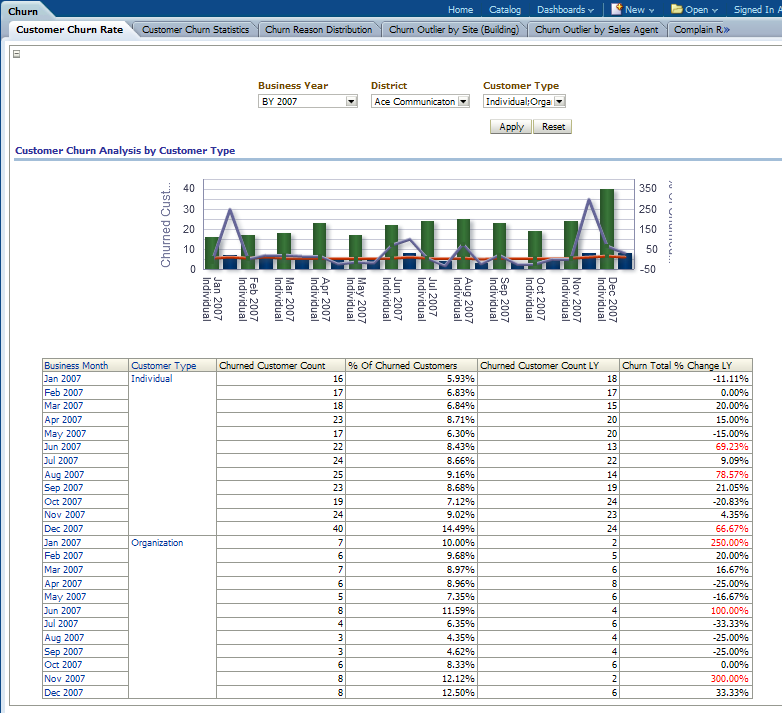
This report, as shown in Figure 12-21 provides year-level churn rate information of an organization based on Customer type. It also shows the Last year information for the user to see differences.
Report dimensions are:
Organization
Business Time
Customer
Figure 12-21 Customer Churn Rate Sample Report
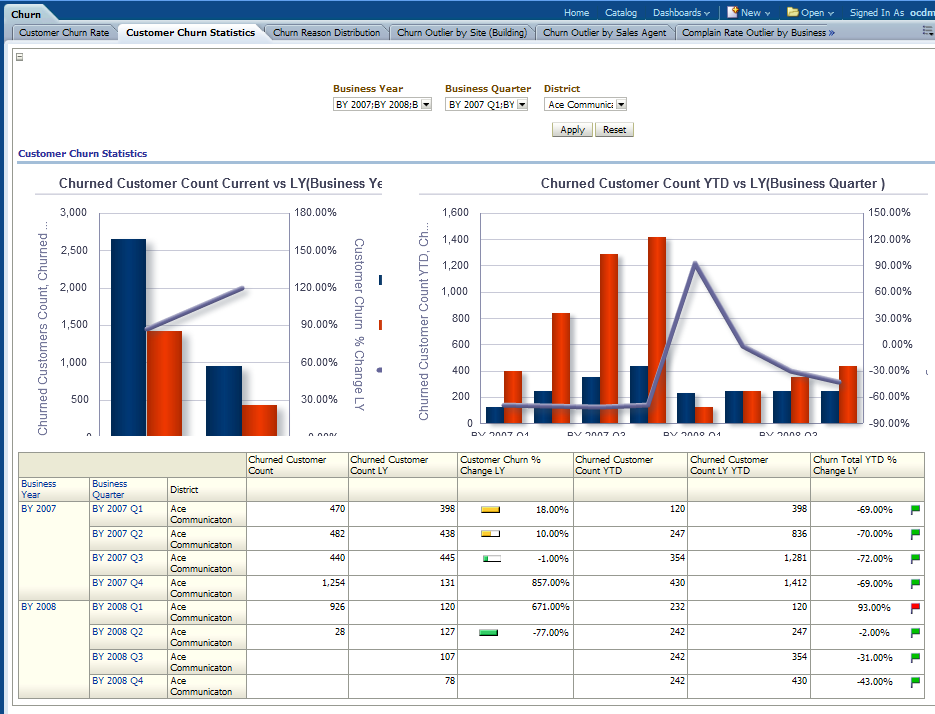
This report, as shown in Figure 12-22 provides year-level subscription performance based on churn statistics relating to a Customer, such as high churn rate analysis for a subscription, and so on. Oracle Communications Data Model provides certain operational measures such as forecasting, prediction, and so on, to over come this problem This data can be analyzed together with LY and YTD data.
Report dimensions are:
Organization
Business Time
Customer
Figure 12-22 Customer Churn Statistics Sample Report
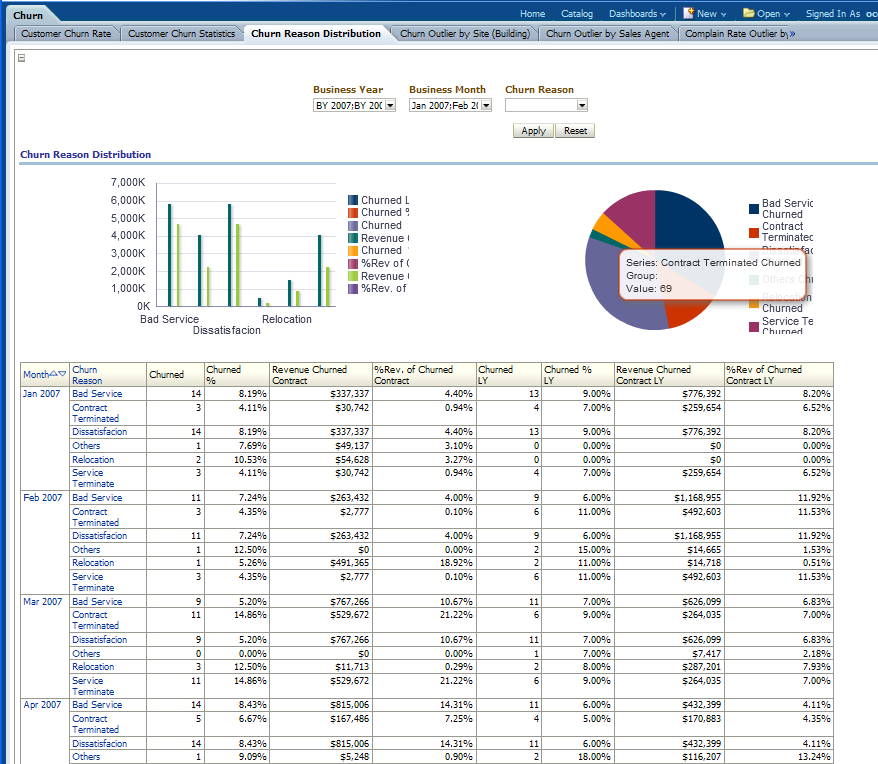
This report as shown in Figure 12-23 identifies the year level top reasons that lead the customers to move out of the service providers. It also gives the flexibility to compare the same with last year churn information. Thus, it gives the service providers a way to analyze the churn situation according to customer stated churn reasons.
Report dimensions are:
Business Time
Churn Reason
Figure 12-23 Churn Reason Distribution Sample Report
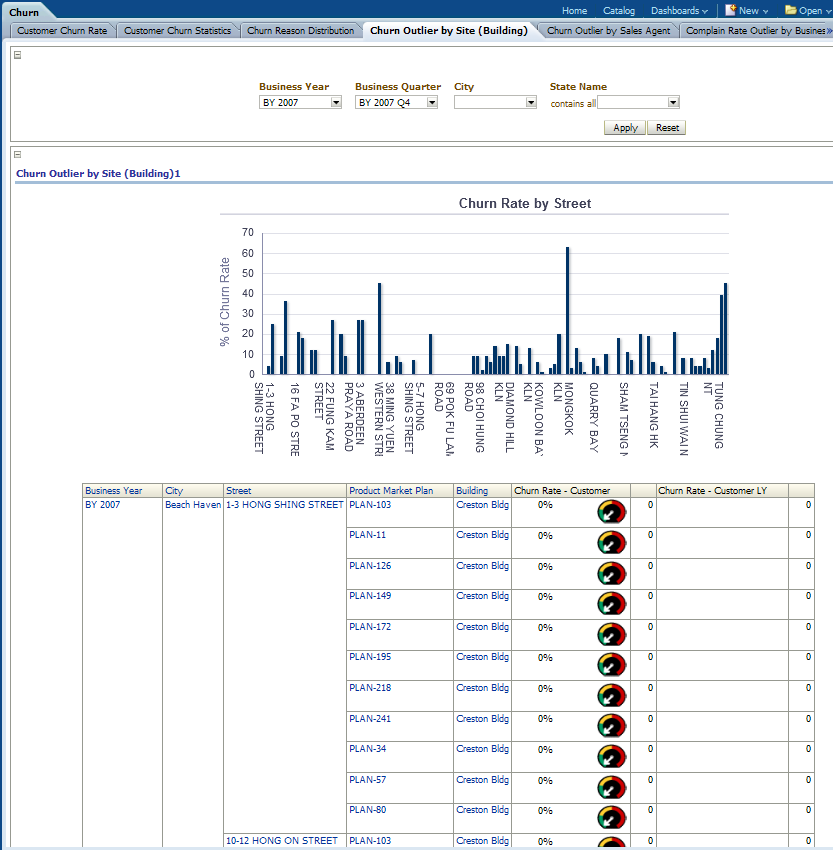
This report, as shown in Figure 12-24 mainly speaks about the broadband or Fix Line related churn analysis pertaining to one building or an area. The churn rates are displayed for all building in selected area, and those extremely high churn rates are identified as “Churn Outlier” beside the churn rate, marked by number “1” and background as RED.
It can help identify the churn related problem such as network problems, arrival of new competitors, and so on. For example, when competitors launch a promotion or your network fails, the churn rate may go up. This report can help identify the problem before huge revenue loss occurs.
Report dimensions are:
Business Time
Geography
Product Market Plan
Figure 12-24 Churn Outlier by Site (Building) Sample Report
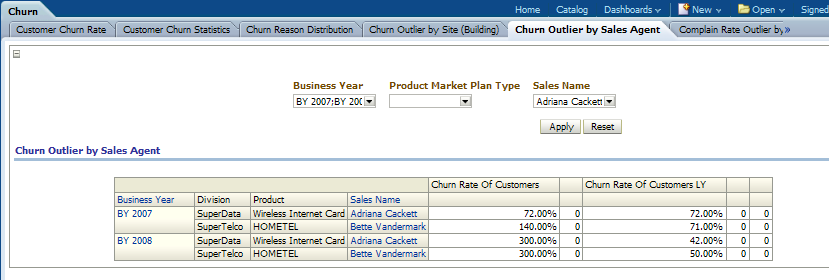
This report, as shown in Figure 12-25 identifies the extremely high churn rate in the customers brought in by certain sales representative agents. For example, the sales agent may introduce the package to those incapable of paying the bill, or to his friends who churn right after acquiring the promotion gifts. Thus it enables a service providers to identify fraud cases by sales agents.
Report dimensions are:
Business Time
Organization
Product Market Plan
Sales Channel Representative
Figure 12-25 Churn Outlier by Sales Agent Sample Report
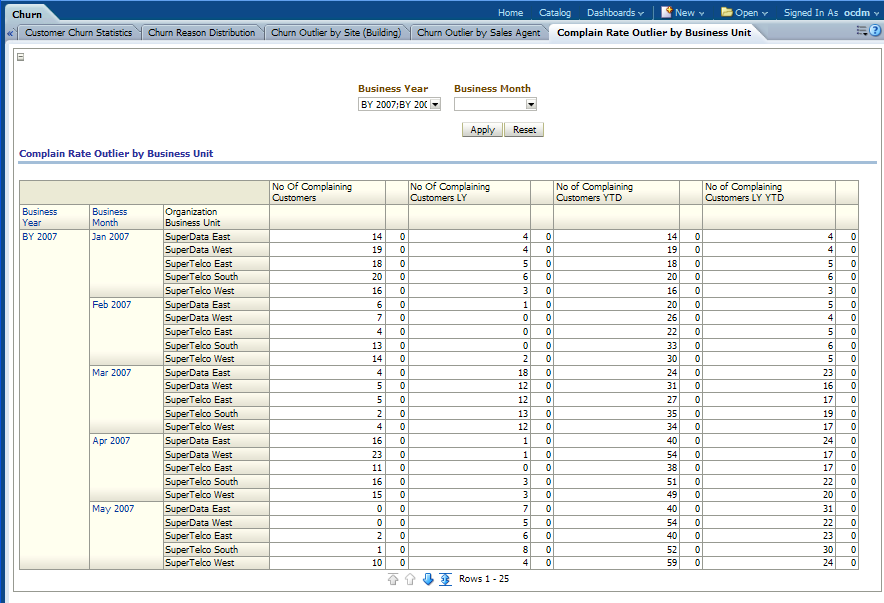
This report, as shown in Figure 12-26 works in the same way as the report “Churn Outlier by Building”. However, instead of detecting a high churn rate, which already incurred revenue loss, this report tries to identify those areas where an extremely high compliant rate is observed. The report also shows the complaint rate in LY, YTD and LY YTD.
Report dimensions are:
Business Time
Figure 12-26 Complain Rate by Business Unit
This area includes the reports: Predicted Churner Life Time Value Chart (by SVM), Retention Cumulative Gain, Churn Factor Rank, Predicted Churn Customer Report by Revenue Band, Churn Profile DT (Decision Tree) Rule, and Churn Prediction by (SVM result).
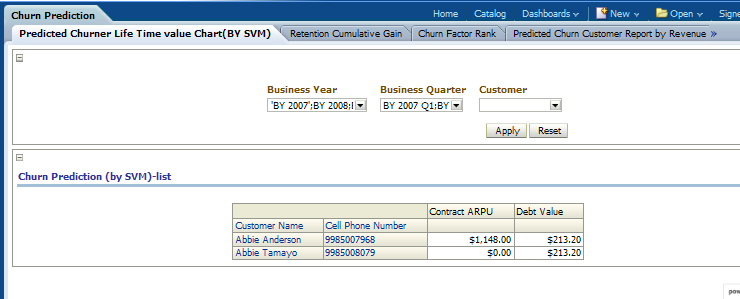
This report as shown in Figure 12-27, mainly speaks about a customers ARPU and Debt Value based on year and month level.
Report dimensions are:
Customer
Business Time
Figure 12-27 Predicted Churner Life Time Value (by SVM) Sample Report
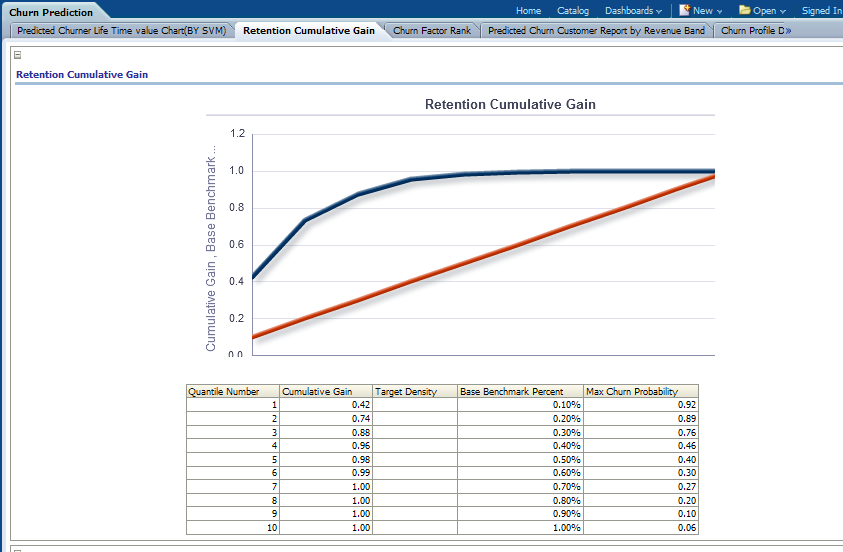
This report as shown in Figure 12-28 shows the Oracle Communications Data Model Churn prediction Model performance; this helps you determine a threshold for the percent of customers to run in the retention program. This retention can be done using phone calls or email. For example, according to the details in Figure 12-28, if the service provider selects 20% of MOST Likely churners according to the Oracle Communications Data Model Churn Prediction model, they can cover about 74% of real churners.
The chart here shows the accuracy of customers so identified under retention program prediction rather than picking on random selection of customers (shown as a straight line).
Report dimensions are:
Churn SVM ROC
Figure 12-28 Retention Cumulative Gain Sample Report
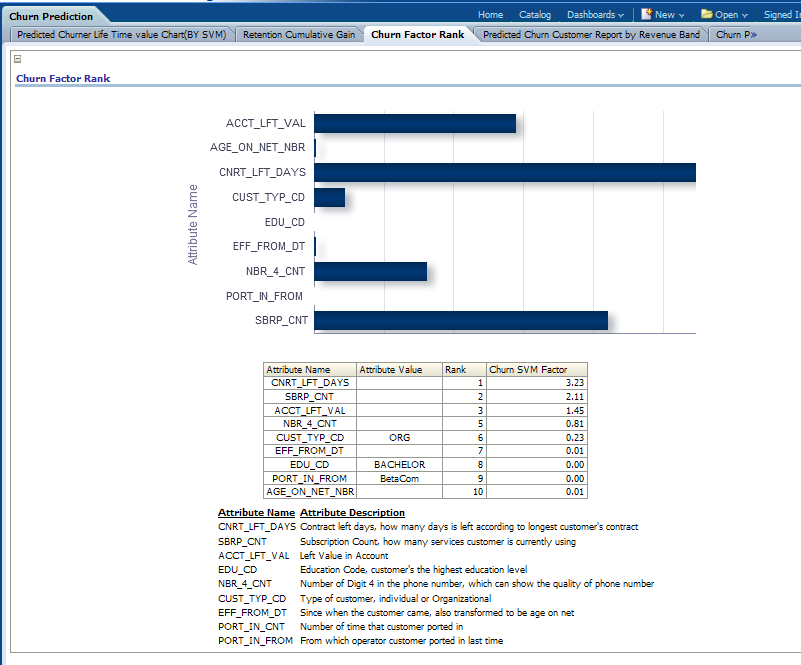
This as shown in Figure 12-29 can help you understand which attribute is more important in determining a customer churning pattern. The factors are ranked according to the SVM Coefficients from the Churn prediction model. The chart can help marketing understand the customers for a better campaign strategy.
Report dimensions are:
Churn SVM ROC
Figure 12-29 Churn Factor Rank Sample Report
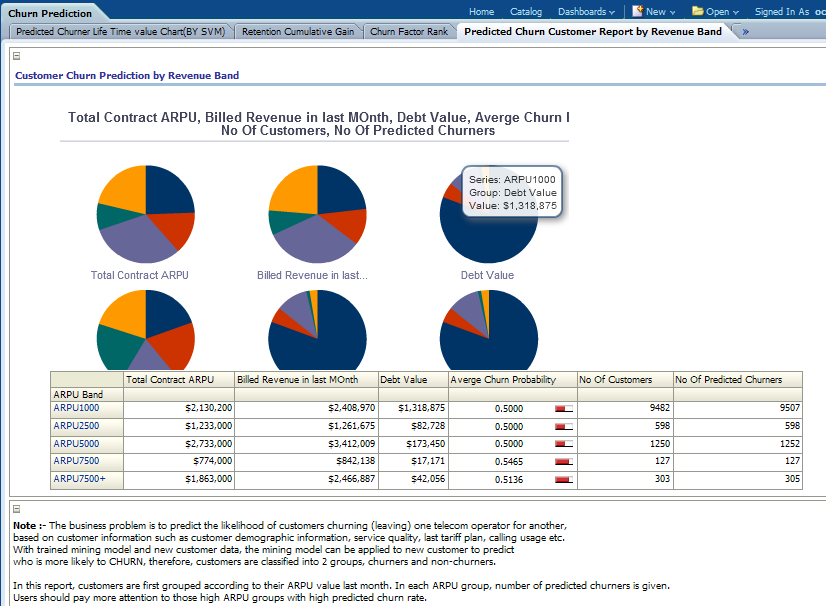
This report, as shown in Figure 12-30 shows the summary of customers and the summary of who may churn in the next month. The customers are binned into ARPU Band according to their last month revenue ARPU. In each ARPU band, the total revenue, debt value and Number of Predicted churners are displayed.
You can drill down into each ARPU band by clicking the ARPU band to see a customer list belonging to that ARPU band.
Report dimensions are:
ARPU Band
Figure 12-30 Customer Churn Prediction by Revenue Band Sample Report
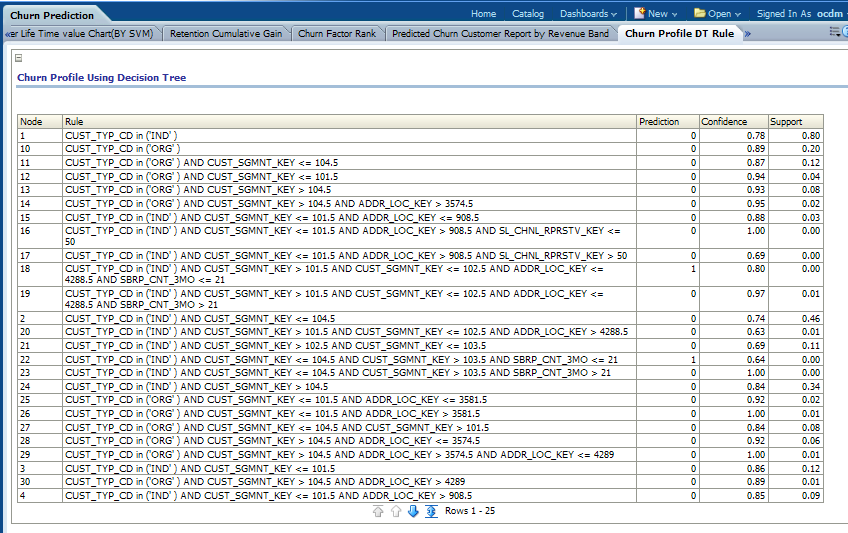
This report as shown in Figure 12-31, mainly speaks about the customers churn profiling for each Decision Tree node generated by the decision tree Churn Prediction model.
Figure 12-31 Churn Profile Decision Tree Rule Sample Report
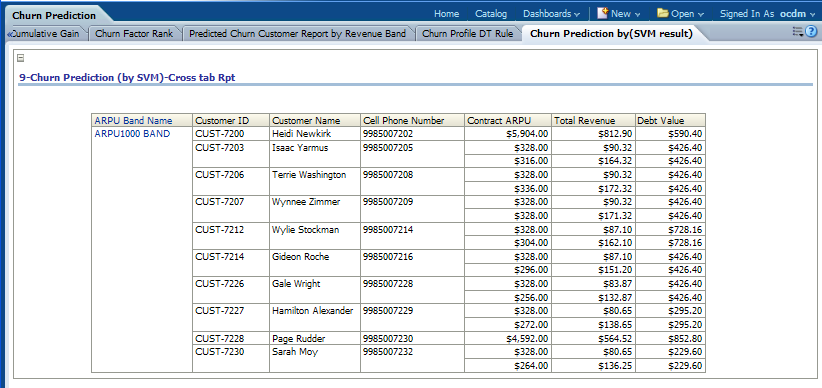
This as shown in Figure 12-32, identifies the patterns of customers churning (leaving) based on customer information such as customer demographic information, service quality, last tariff plan, calling usage, and other factors. Base lining on these patterns, the model can also do the calculation over current customer base (called 'Apply') to predict who the customers are mostly like to churn in next few months. With these predictions, operators can initiate certain retention programs to reduce the customer churn rate.
Report dimensions are:
Business Time
Organization
Customer
Figure 12-32 Churn Prediction List Sample Report
The marketing area sample reports include the following areas:
This area includes the report Customer Promotion List.
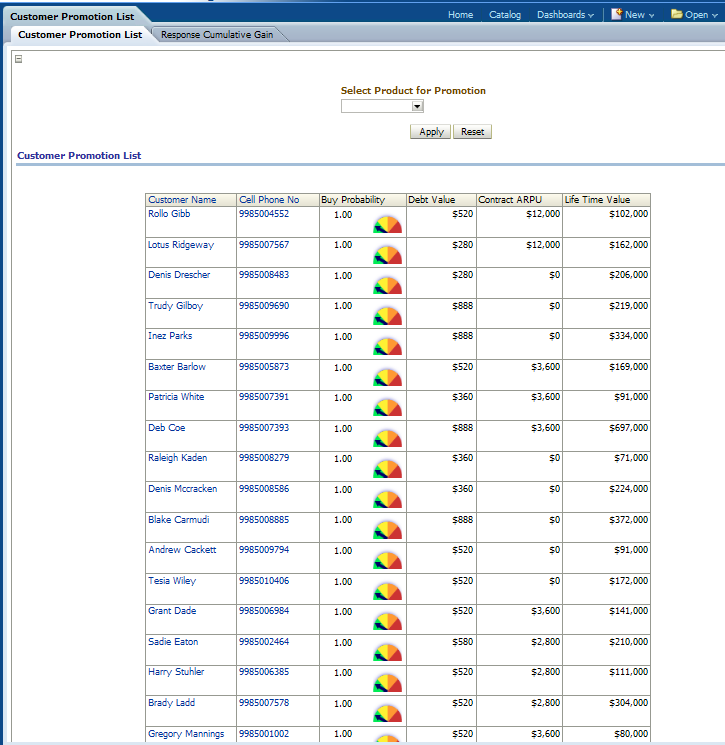
This report, as shown in Figure 12-33 provides a list of customers ranked by their probability of buying a product. For each customer, the life time value , ARPU, and Debt value are displayed for quick reference.
The buying probability of each customer on the product is calculated by Oracle Communications Data Model Targeted Promotion Mining model.
Report dimensions are:
Customer
Figure 12-33 Customer Promotion List Sample Report
This area includes the reports: Customer Market Share Report, Customer Life Time Span Detail, and Life Time Value (LTV).
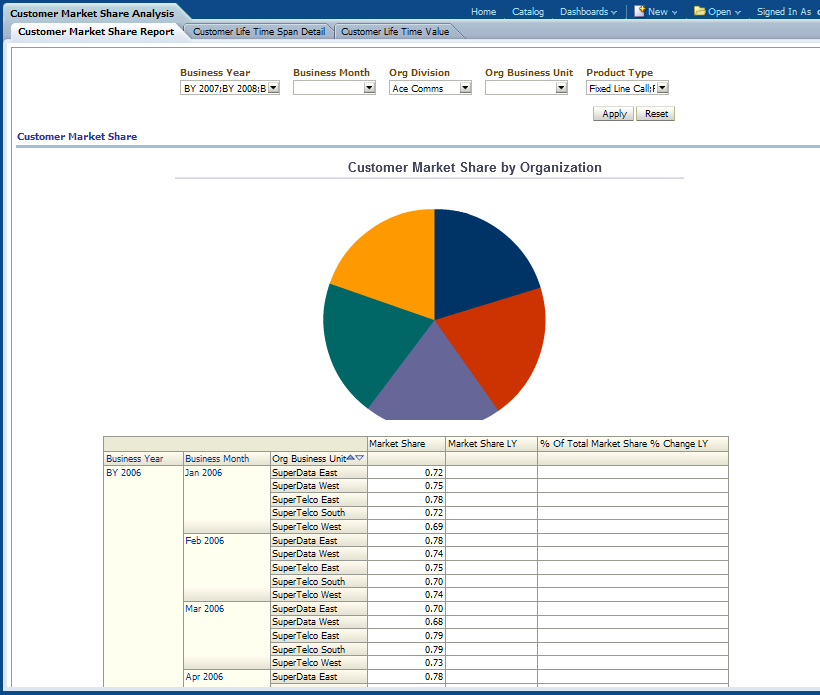
This report as shown in Figure 12-34 shows month-level Customer Market share, comparing with competitors. The data is acquired from an external marketing source.
Report dimensions are:
Business Time
Organization
Product Type
Figure 12-34 Customer Market Share Analysis Sample Report
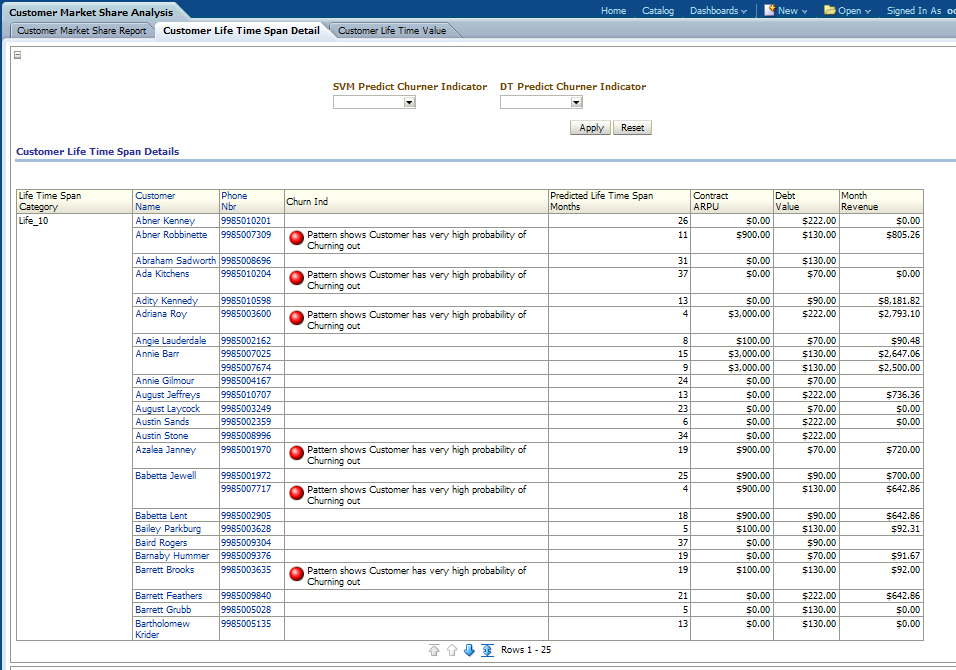
This report, as shown in Figure 12-35 provides month-level transaction activity information based on customer life time span measures, for one or more customers.
Report dimensions are:
Customer
Figure 12-35 Customer Life Time Span Detail Sample Report
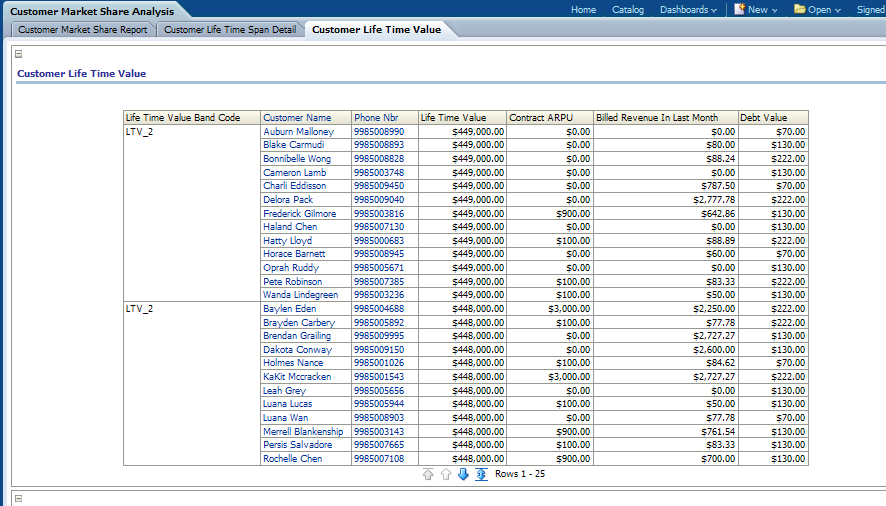
This report, as shown in Figure 12-36 shows life time value of a customer. Customer lifetime value has intuitive appeal as a marketing concept, because in theory it represents exactly how much each customer is worth in monetary terms, and therefore exactly how much a marketing department should be willing to spend to acquire each customer. Customer relationships are often divided into two categories. In contractual or retention situations, customers who do not renew are considered "lost for good". In customer migration situations, a customer who does not buy (in a given period or from a given catalog) is still considered a customer of the firm because she may very well buy at some point in the future. In customer retention situations, the firm knows when the relationship is over. One of the challenges for firms in customer migration situations is that the firm may not know when the relationship is over (as far as the customer is concerned).
Report dimensions are:
Customer
Figure 12-36 Life Time Value (LTV) Sample Report
This area includes the reports: Current Customer Base, Customer Base Organization Share, and Customer Base Product Share.
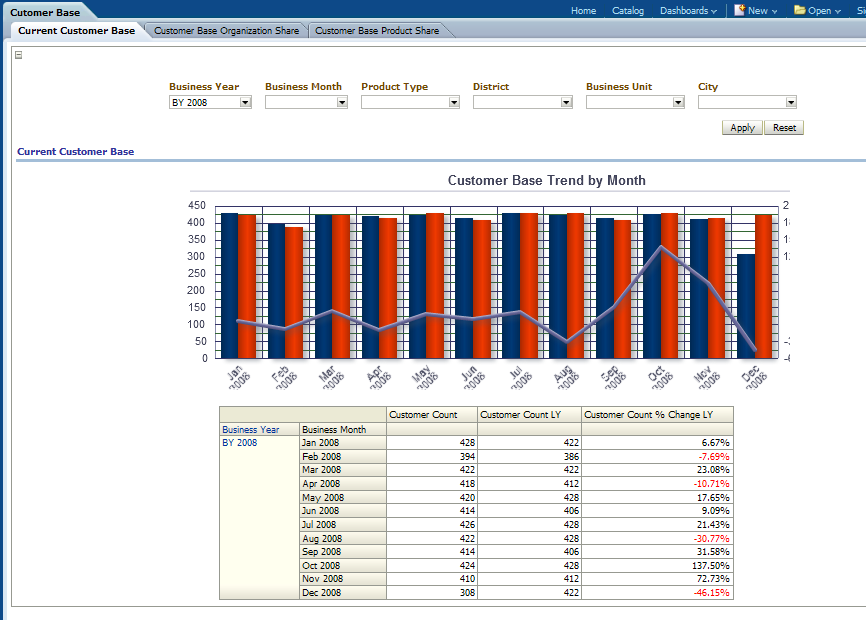
This report, as shown in Figure 12-37 provides month-level transaction activity information based on no of customer measures, for one or more locations.
Report dimensions are:
Business Time
Organization
Product
Geography
Figure 12-37 Current Customer Base Sample Report
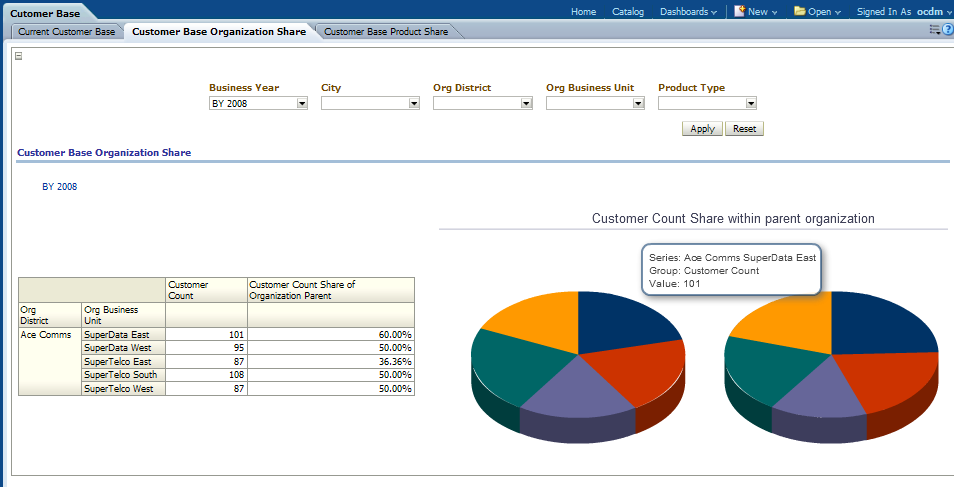
This as shown in Figure 12-38 provides month-level number of customers for each organization business unit, and also gives the share of customer count inside their parent organization.
Report dimensions are:
Business Time
Organization
Product Type
Figure 12-38 Customer Base Organization Share Sample Report
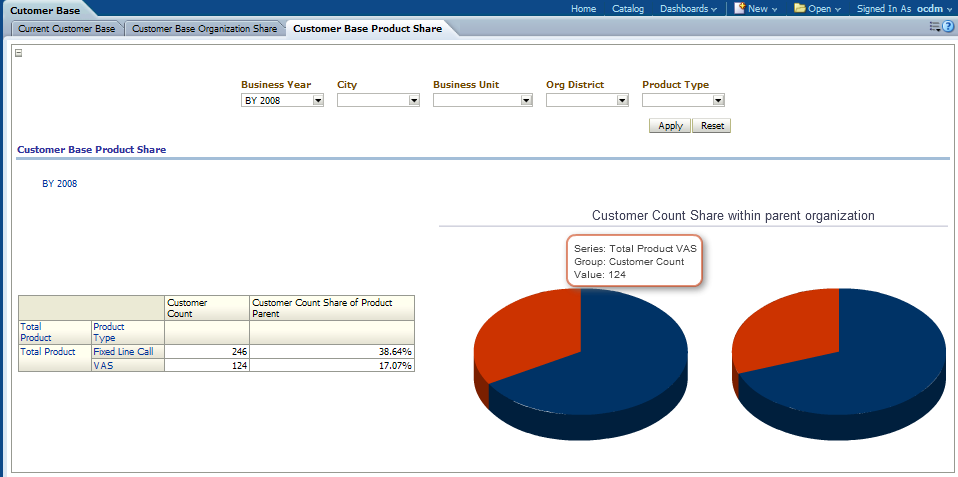
This as shown in Figure 12-39 provides month-level number of customers for each products (subscription). The customer share of each product is listed for the selected products and organizations.
Report dimensions are:
Business Time
Organization
Product Type
Figure 12-39 Customer Base Product Share Sample Report
The network area sample reports include the following areas:
This area includes the reports: Network Capacity, Minutes of Usage, Airtime per Subscription, and Load During Busy Hours.
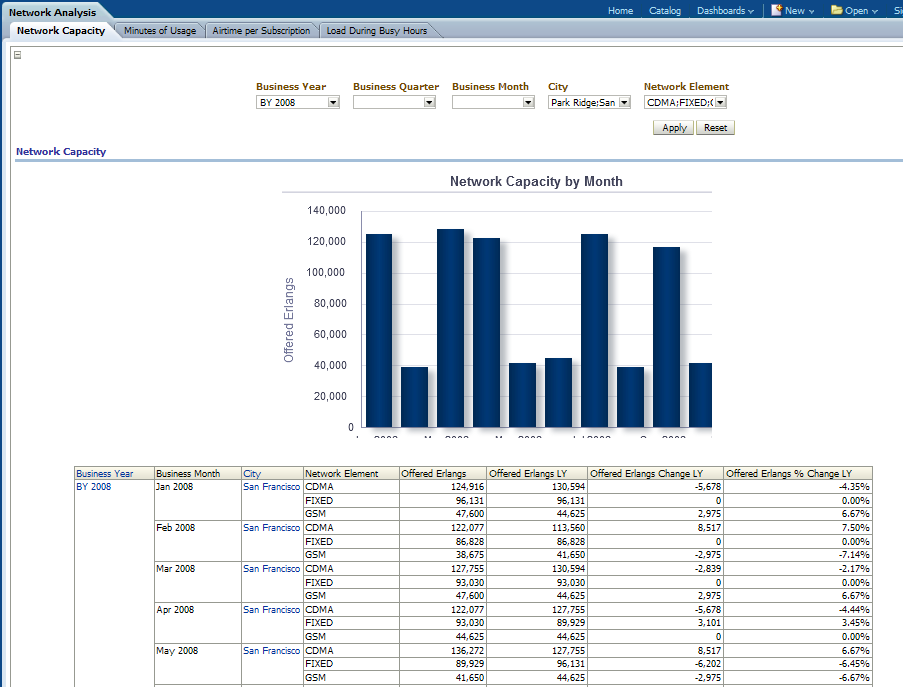
This report, as shown in Figure 12-40 provides month-level transaction activity information based on network capacity measures, for one or more locations.
Report dimensions are:
Business Time
Geography
Network Element
Figure 12-40 Network Capacity Sample Report
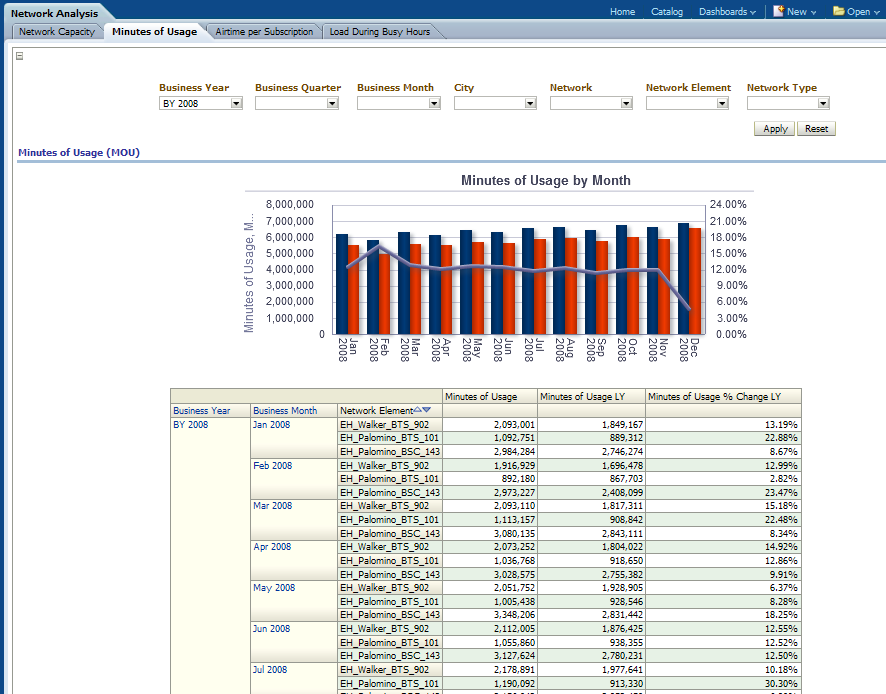
This as shown in Figure 12-41 provides month-level call usage summary information based on call duration in minutes, in certain areas and the network elements.
Report dimensions are:
Business Time
Network Element
Figure 12-41 Minutes of Usage Sample Report
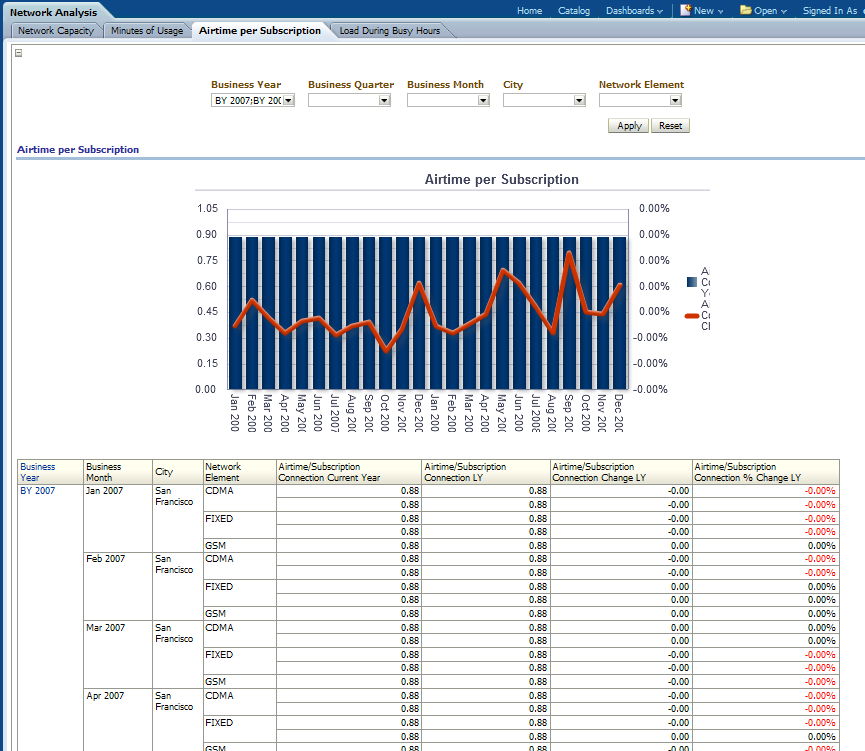
This as shown in Figure 12-42 provides month-level transaction activity information based on airtime per subscription connection measures, for one or more location.
Report dimensions are:
Business Time
Network Element
Geography
Peak Off peak Time
Figure 12-42 Airtime per Subscription Sample Report
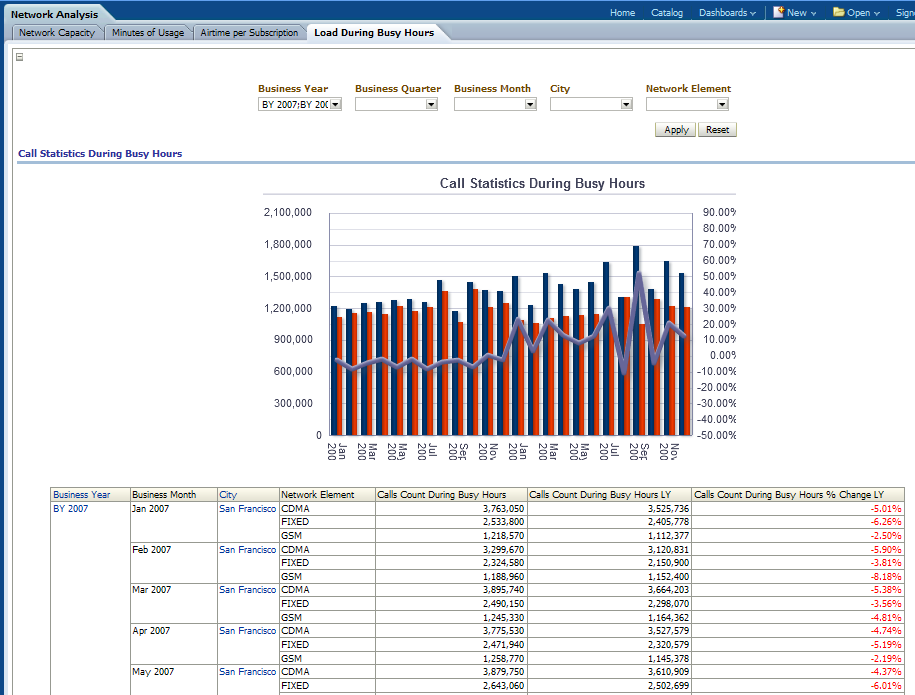
This report, as shown in Figure 12-43 provides month-level transaction activity information based on calls count during busy hours measures, for one or more location.
Report dimensions are:
Business Time
Network Element
Geography
Peak Off peak Time
Figure 12-43 Load During Busy Hours Sample Report
This area includes the reports: Traffic by Connection, Connections per Site, Dropped Call Rate, Call Failure Rate, Congestion, Connection by Geography, and Connection by Voice Channel.
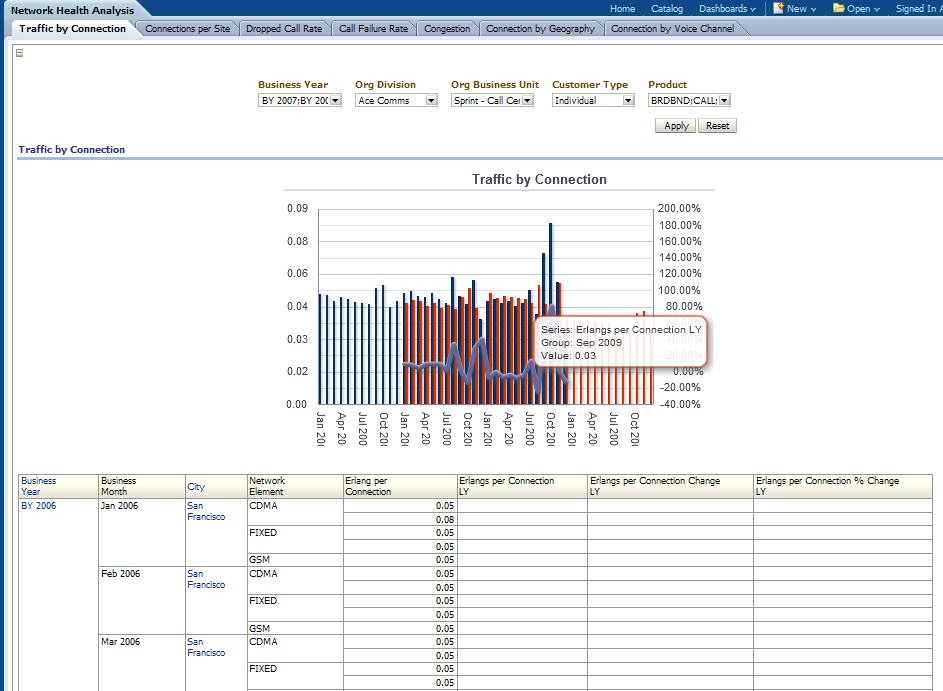
This report, as shown in Figure 12-44 provides month-level transaction activity information based on traffic by connection measures, for one or more location.
Report dimensions are:
Business Time
Network Element
Geography
Peak Off peak Time
Figure 12-44 Traffic by Connection Sample Report
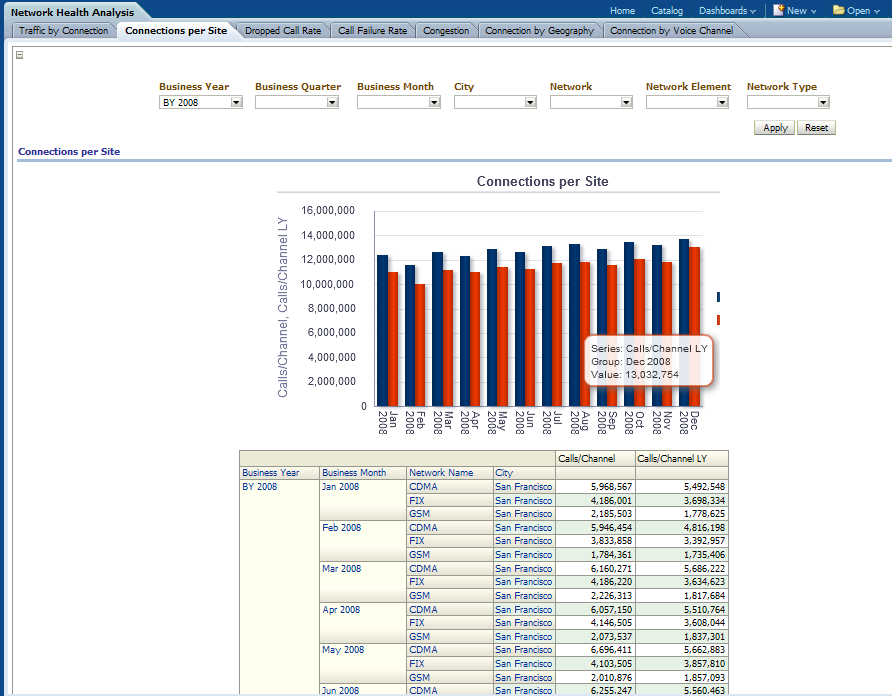
This report, as shown in Figure 12-45 provides month-level transaction activity information based on subscriptions per channel measures, for one or more location.
Report dimensions are:
Business Time
Network Element
Geography
Figure 12-45 Connections per Site Sample Report
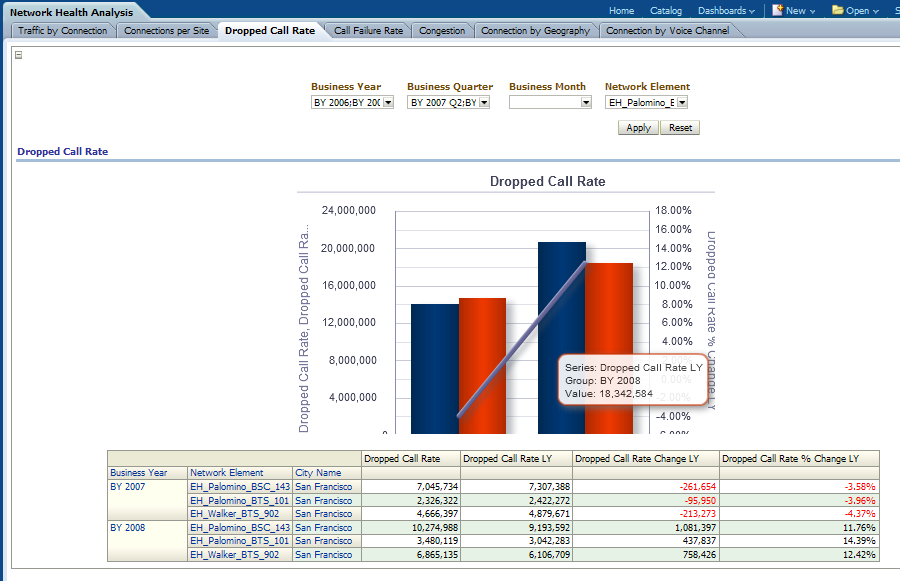
This report, as shown in Figure 12-46 provides month-level transaction activity information based on dropped call rate measures, for one or more location.
Report dimensions are:
Business Time
Network Element
Geography
Figure 12-46 Dropped Call Rate Sample Report
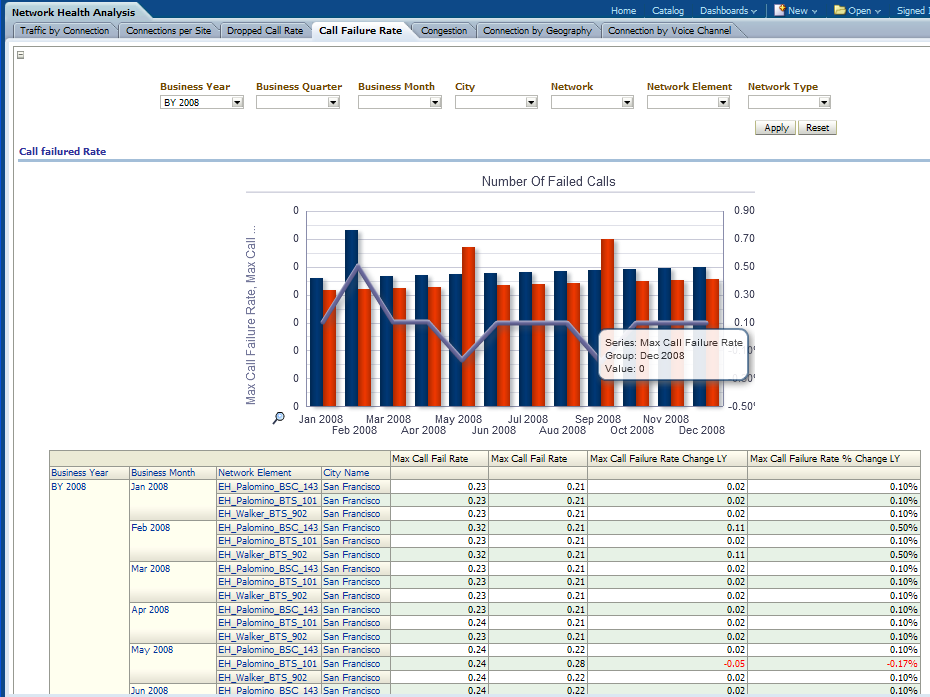
This report, as shown in Figure 12-47 provides month-level transaction activity information based on network congestion measures, for one or more location.
Report dimensions are:
Business Time
Network Element
Geography
Figure 12-47 Call Failure Rate Sample Report
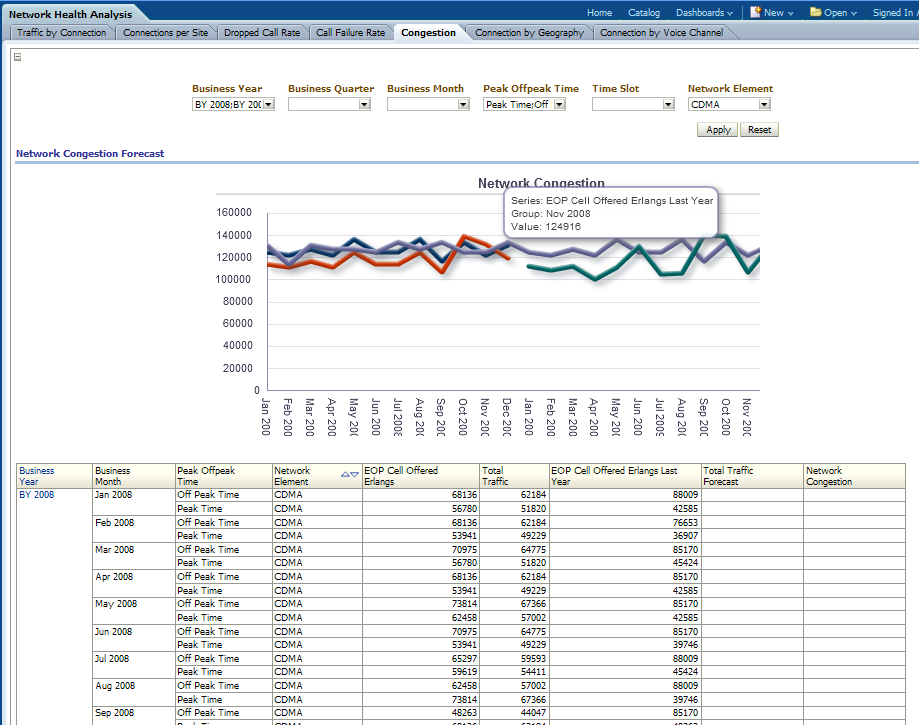
This report, as shown in Figure 12-48 provides month-level transaction activity information based on end of period cell offered erlangs measures, for one or more location.
Report dimensions are:
Business Time
Network Element
Geography
Time Slot
Peak Offpeak Time
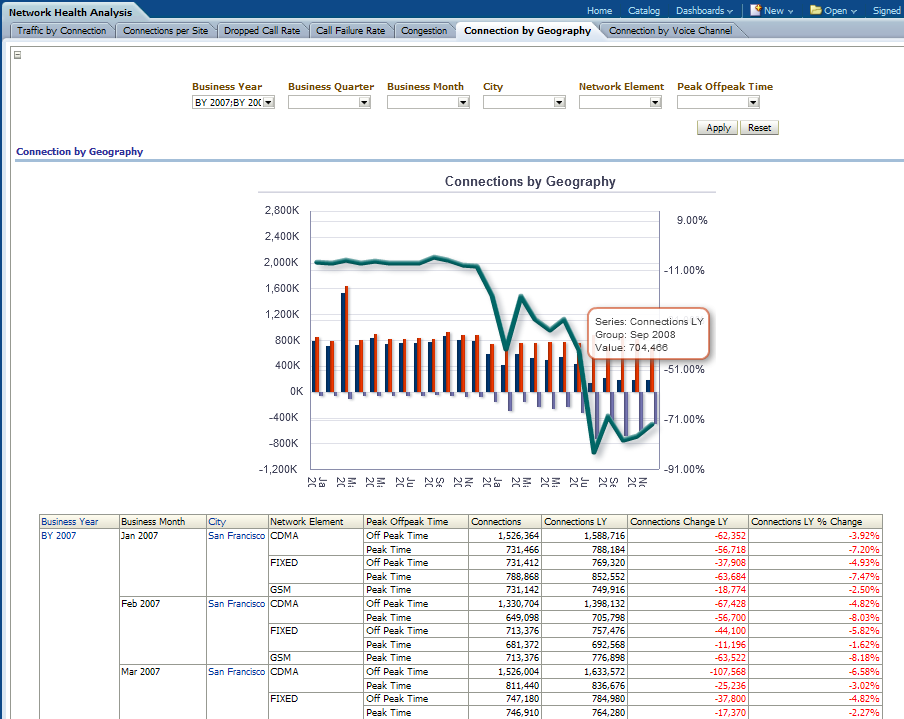
This report, as shown in Figure 12-49 provides month-level transaction activity information based on connections measures, for one or more location.
Report dimensions are:
Business Time
Network Element
Geography
Peak Offpeak Time
Figure 12-49 Connection by Geography Sample Report
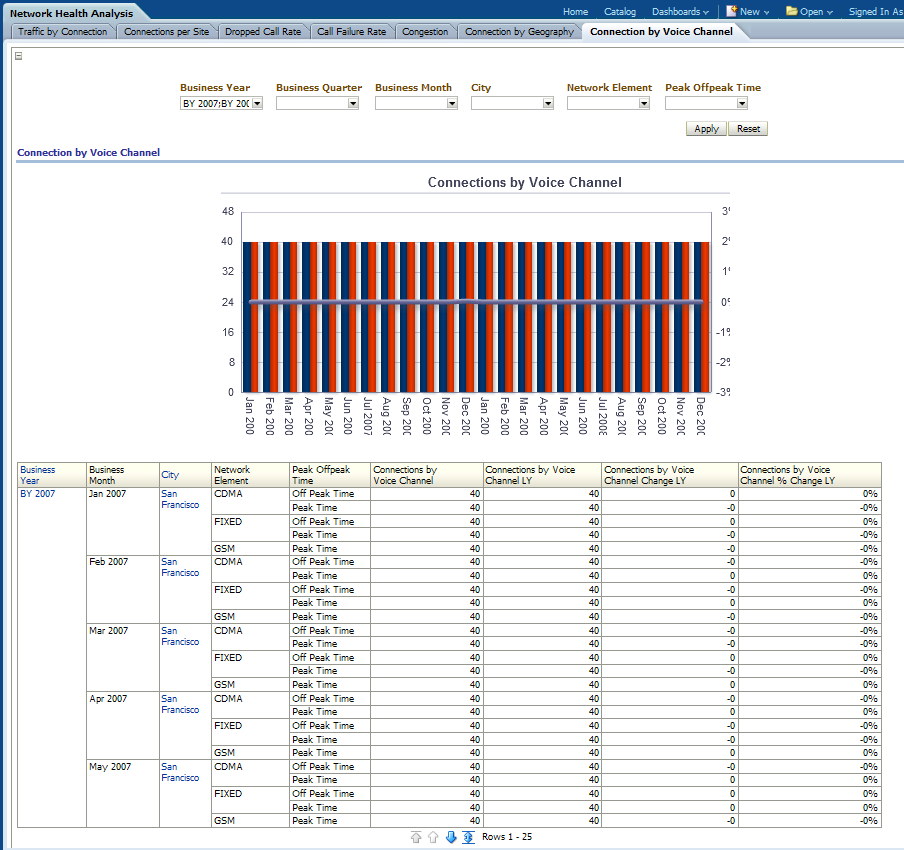
This report, as shown in Figure 12-50 provides month-level transaction activity information based on connections by voice channel measures, for one or more location. This report shows will be used to collect most of the cell parameters.
Report dimensions are:
Business Time
Network Element
Geography
Peak Offpeak Time
Figure 12-50 Connection by Voice Channel Sample Report
This area includes the reports: Number of 911 Calls, Number of Calls by Call Category, Number of Call by Call Service Type, and Number of Calls by Routing Type.
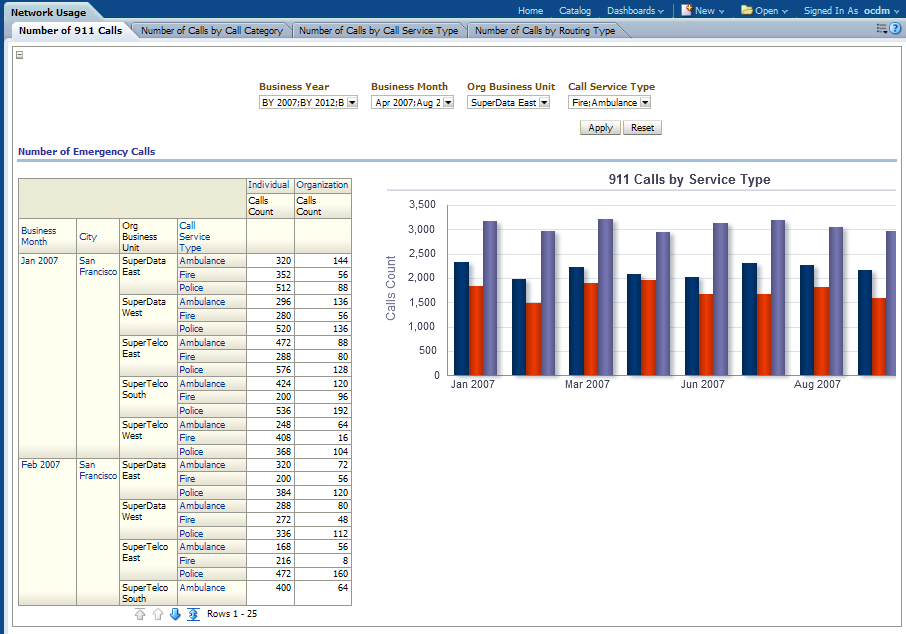
This report, as shown in Figure 12-51 provides the number of 911, emergency, calls.
Report dimensions are:
Organization
Business Time
Customer
Product
Call Service Type
Call Routing Type
Figure 12-51 Network Number of 911 Calls Sample Report
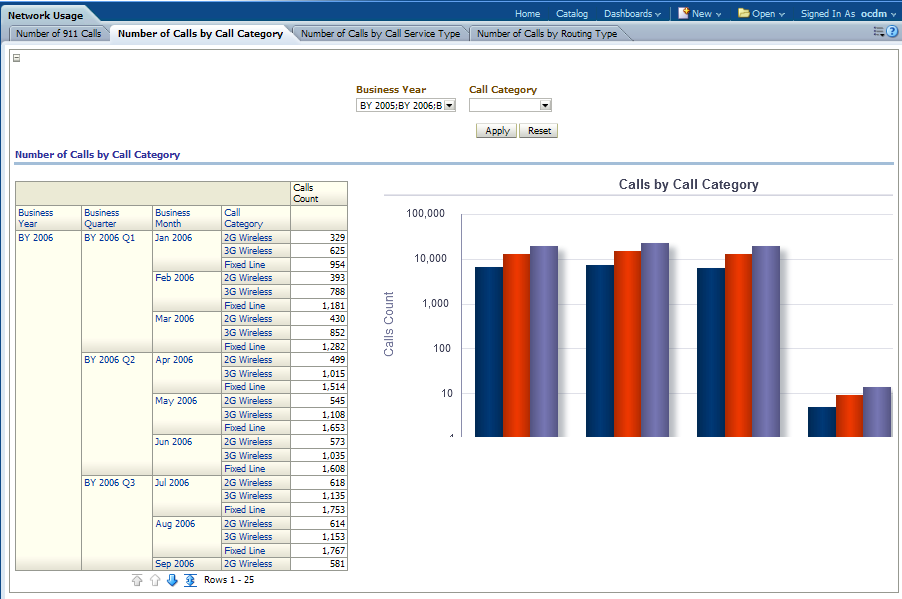
This as shown in Figure 12-52 provides year-level transaction activity information based on no of calls measures, for different types of call categories.
Report dimensions are:
Business Time
Call Category
Figure 12-52 Network Number of Calls by Call Category Sample Report
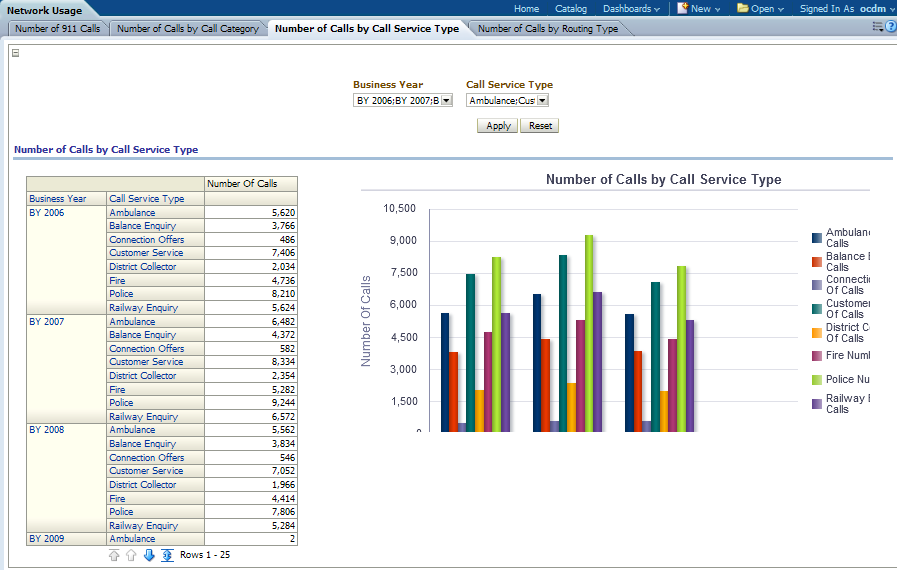
This shown in Figure 12-53 provides year-level transaction activity information based on number of calls measures, for different types of call services.
Report dimensions are:
Business Time
Call Category
Figure 12-53 Network Number of Call by Call Service Type Sample Report
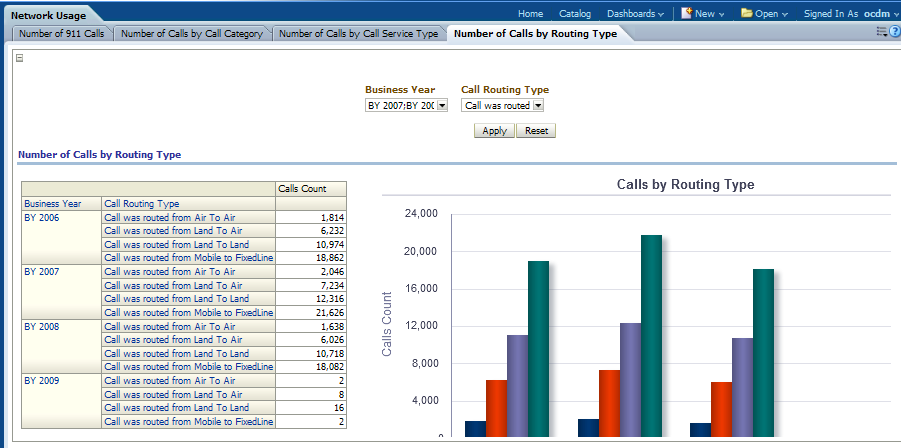
This shown in Figure 12-54 provides year-level transaction activity information based on the number of calls measures, for different types of call routing.
Report dimensions are:
Business Time
Call Routing Type
Figure 12-54 Network Number of Calls by Routing Type Sample Report
The partner management sample reports include the following areas:
This area includes the report Roaming Partner Settlement Summary.
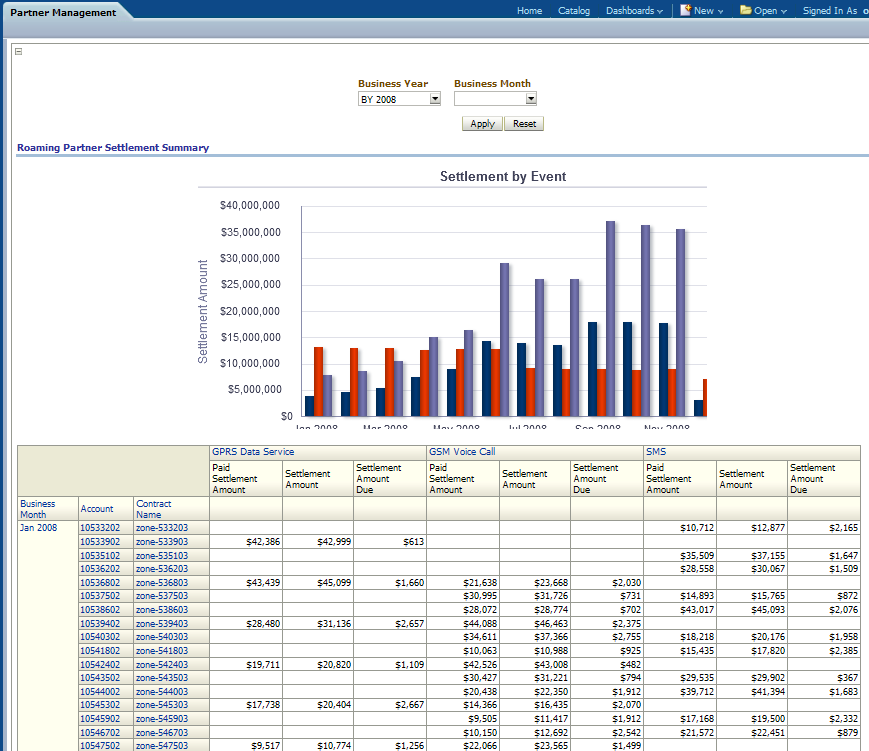
This report, as shown in Figure 12-55 provides month-level transaction activity information based on partner settlement measures, for one or more location. This report shows summary over financial settlement activities happened to partners.
Report dimensions are:
Business Time
Geography
Billing Cycle
Event Type
Account
Party
Contract
Figure 12-55 Roaming Partner Settlement Summary Sample Report
This area includes the reports: Churn Outliner by Partner and Track Dealer Commission and Performance.
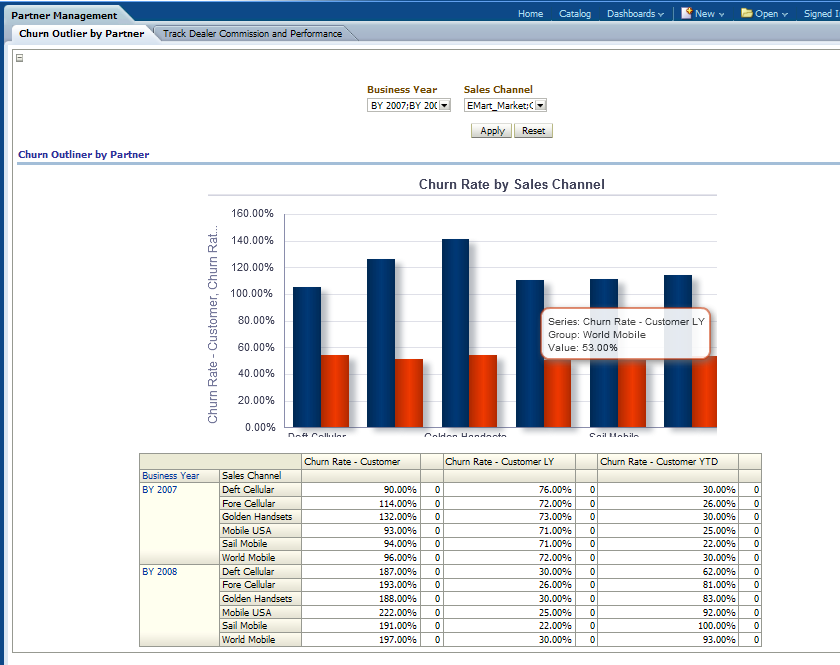
This report, as shown in Figure 12-56 provides year-level transaction activity information based on average churn rate for customer measures, for one or more sales channel.
This demonstrates statistically significant anomalies in churn rate by sales channel or partners (for example which channel records maximum churn) This can help identify problem area domains and facilitates further drill down to identify the cause of the problems (network problems and other problems) and take remedial actions to prevent churns. Actions could be further training or education to the partners, empowering them to offer additional incentives or discounts.
Report dimensions are:
Business Time
Sales Channel
Figure 12-56 Churn Outliner by Partner Sample Report
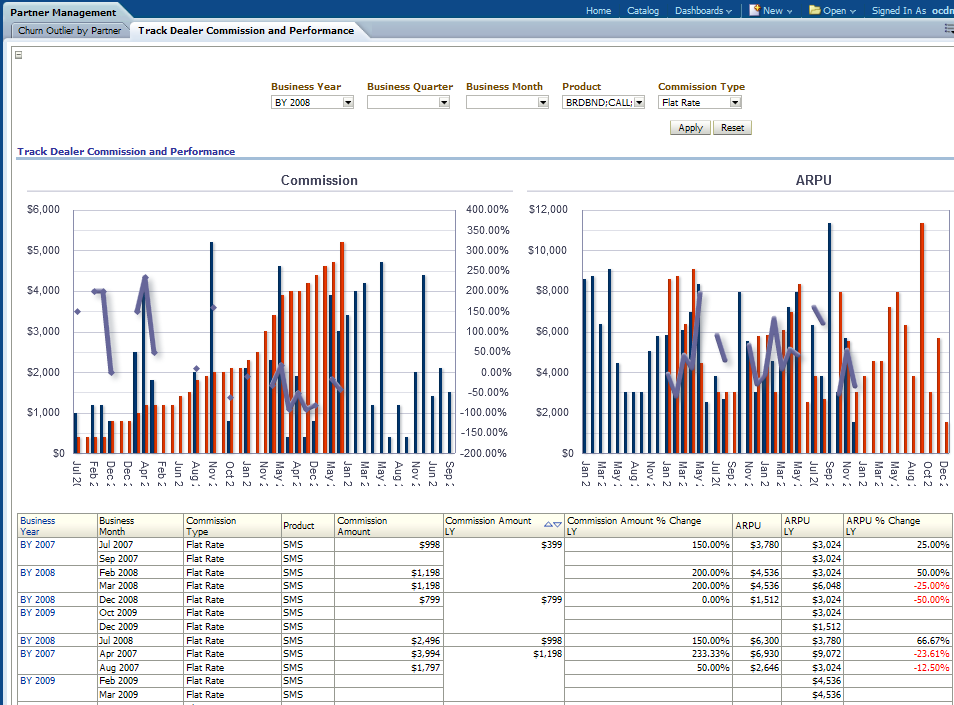
This report, as shown in Figure 12-57 gives the month level Dealer performance and commission generated based on a product.
Report dimensions are:
Business Time
Commission Type
Product
Figure 12-57 Track Dealer Commission and Performance Sample Report
This area includes the report Partner Content Sales.
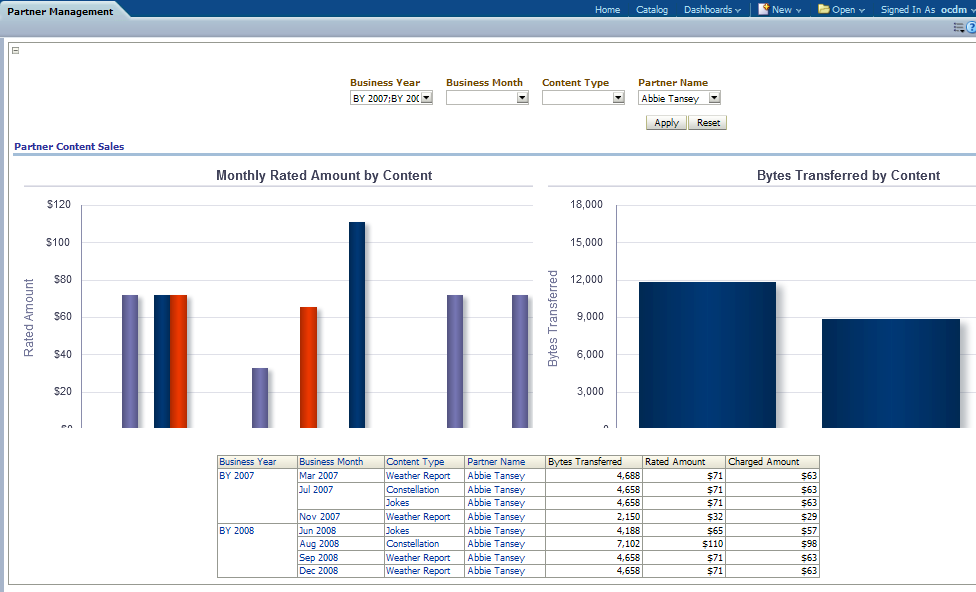
This report, as shown in Figure 12-58 provides month-level transaction activity information based on data usage measures, for one or more content.
Report dimensions are:
Business Time
Content Type
Figure 12-58 Partner Content Sales Sample Report
This area includes the report: Partner Management.
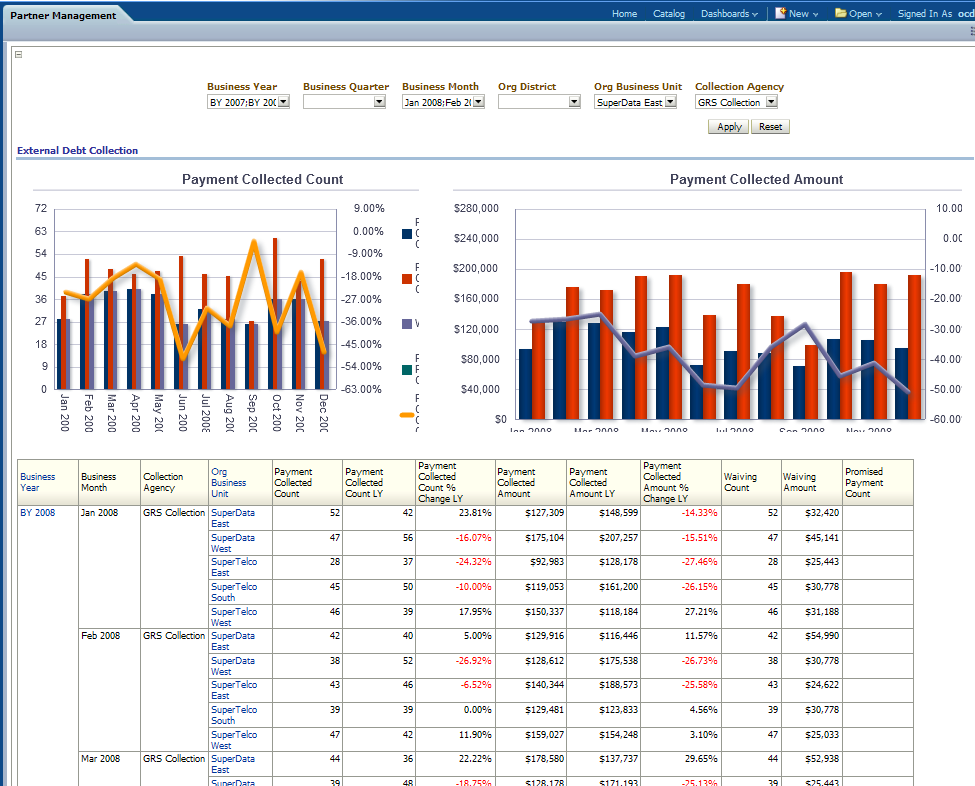
This report, as shown in Figure 12-59 gives month level debt collected for the services usage done by the customers through third part channels like banks and so on.
Report dimensions are:
Business Time
Collection Agency
Organization
Figure 12-59 External Debt Collection Sample Report
The product management sample reports include the following areas:
This area includes the report Product Performance.
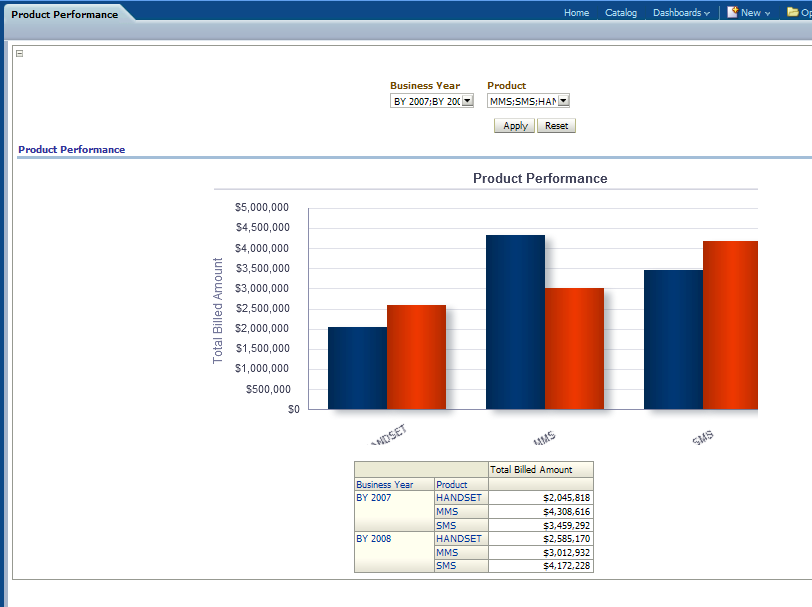
This report, as shown in Figure 12-60 provides year-level transaction activity information based on total bill amount measures, for one or more products.
Report dimensions are:
Business Time
Product
Figure 12-60 Product Performance Sample Report
This report, as shown in Figure 12-61 shows average profit per customer.
Report dimensions are:
Business Time
Organization
Product
Customer
The provisioning and service sample reports show the following areas:
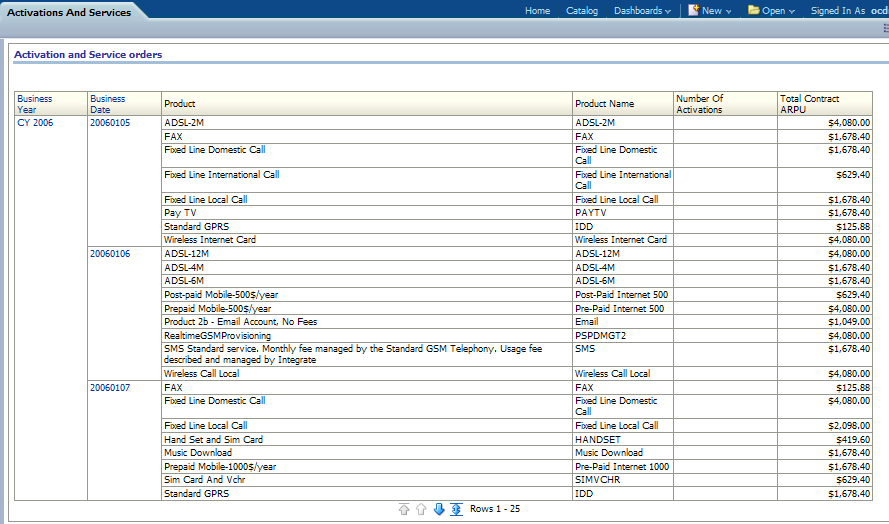
This area includes the report Activation and Service Orders.
This report, as shown in Figure 12-62 provides business year and business date-level transaction activity information based on contract ARPU.
Report dimensions are:
Business Time
Product
Figure 12-62 Activation and Service Orders Sample Report
This area includes the report: Order Volume by Order Status, Order Volume by Order Type, Order Volume by Product, Order Change per Quarter, Order Volume by Product Type, and Fall Out Rate by Product Type.
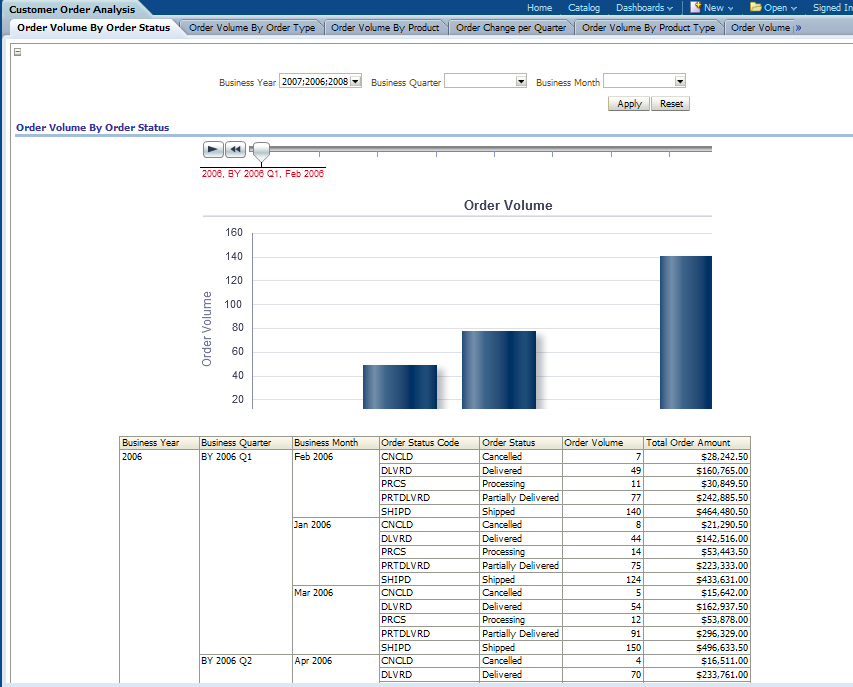
This as shown in Figure 12-63, provides business year, business quarter, and business month-level information based on order volume by order status.
Report dimensions are:
Business Time
Figure 12-63 Order Volume by Order Status
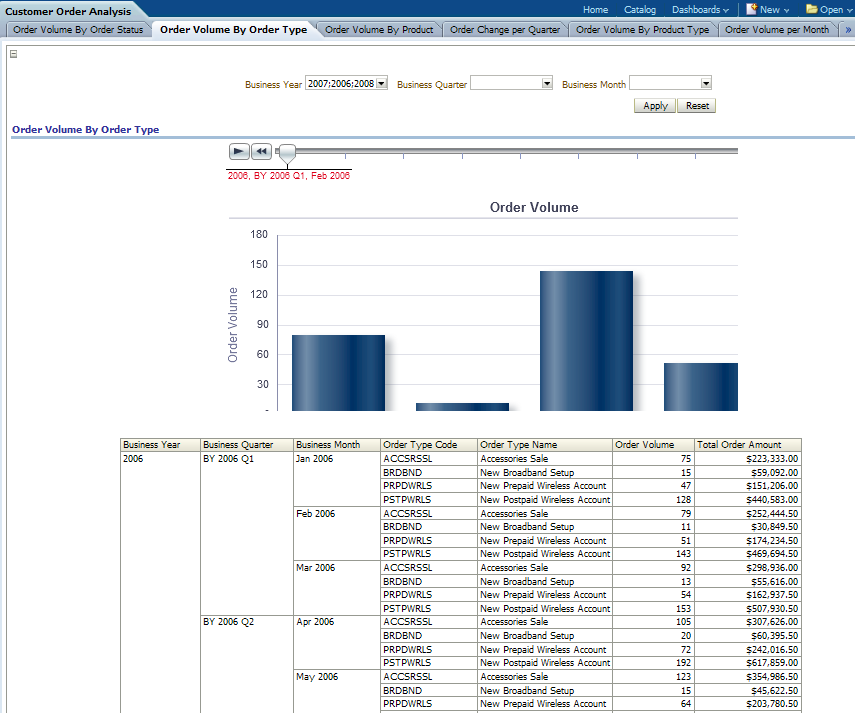
This report, as shown in Figure 12-64 provides business year, business quarter, and business month-level information based on order volume by order type.
Report dimensions are:
Business Time
Figure 12-64 Order Volume by Order Type Sample Report
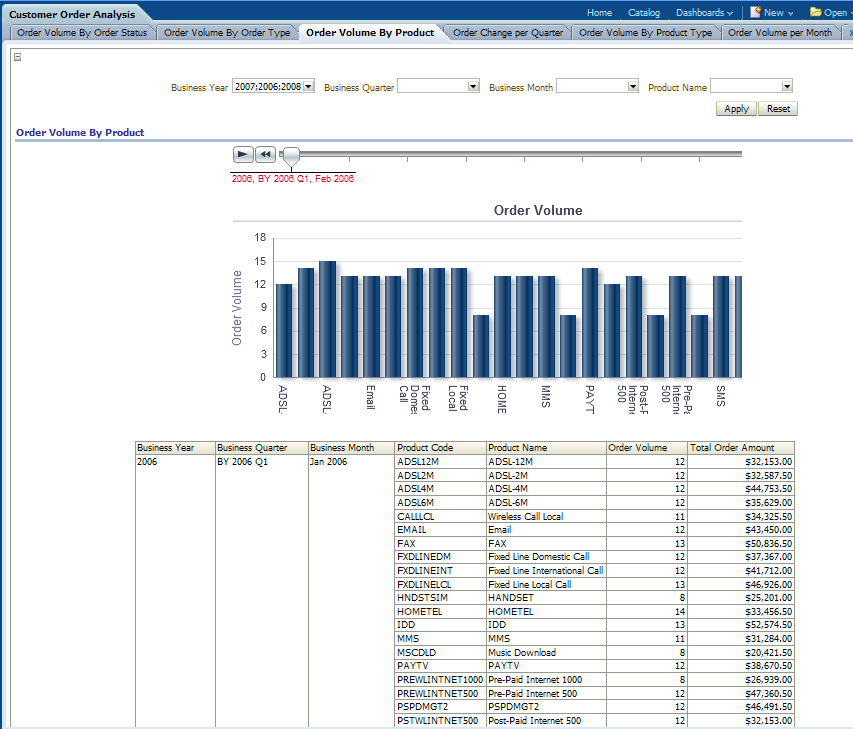
This report, as shown in Figure 12-65 business year, business quarter, and business month-level information based on order volume by product.
Report dimensions are:
Business Time
Product
Figure 12-65 Order Volume by Product Sample Report
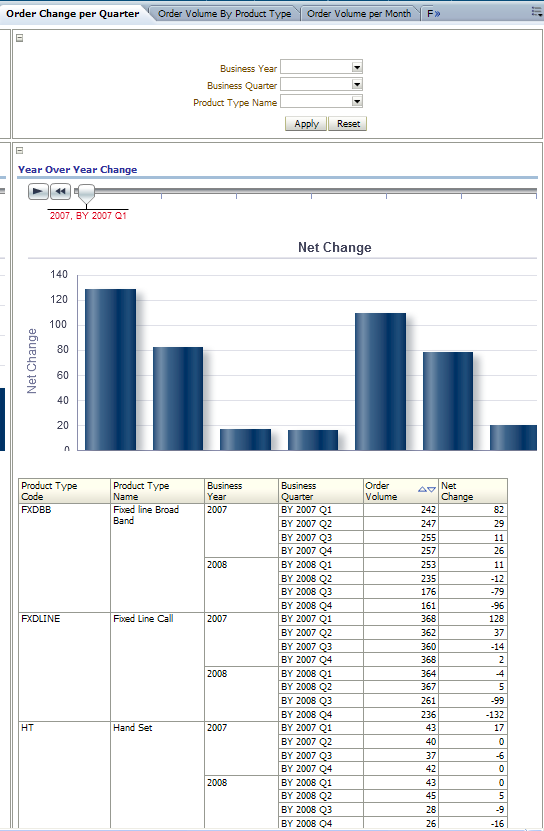
This report, as shown in Figure 12-66 and Figure 12-67 provides business year, business quarter-level information based on order volume change per quarter.
Report dimensions are:
Business Time
Product Type
Figure 12-66 Prior Quarter Change Sample Report (part one of report)
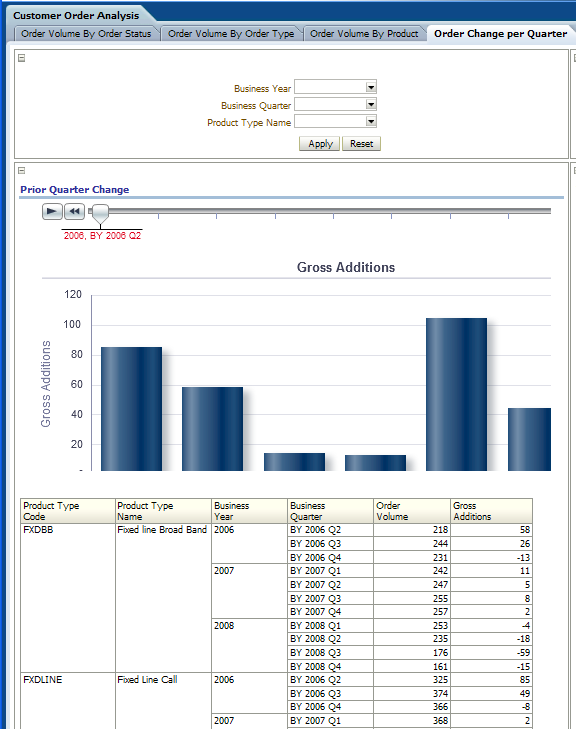
Figure 12-67 Year Over Year Change Sample Report (part 2 of report)
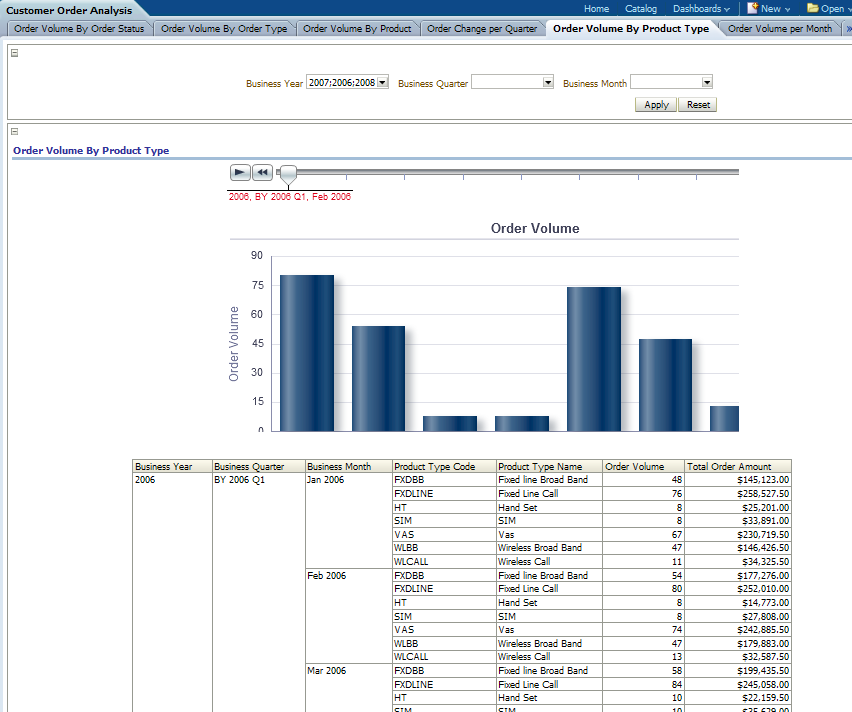
This report, as shown in Figure 12-68 provides business year, business quarter, and business month-level information based on order volume by product type.
Report dimensions are:
Business Time
Figure 12-68 Order Volume by Product Type Sample Report
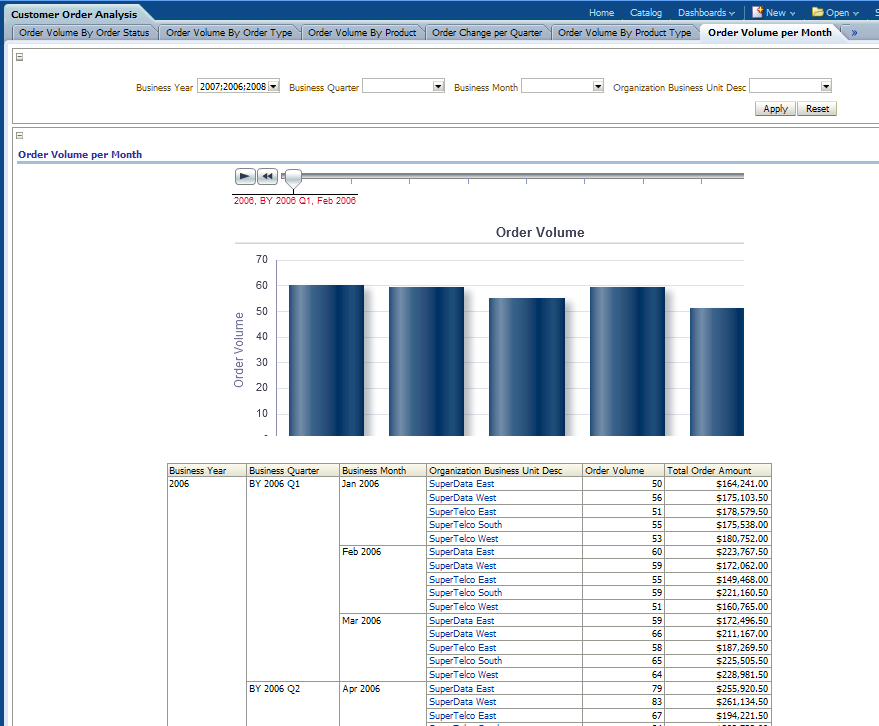
This report, as shown in Figure 12-69 provides business year, business quarter, and business month-level information based on order volume per month.
Report dimensions are:
Business Time
Organization Unit
Figure 12-69 Order Volume per Month Sample Report
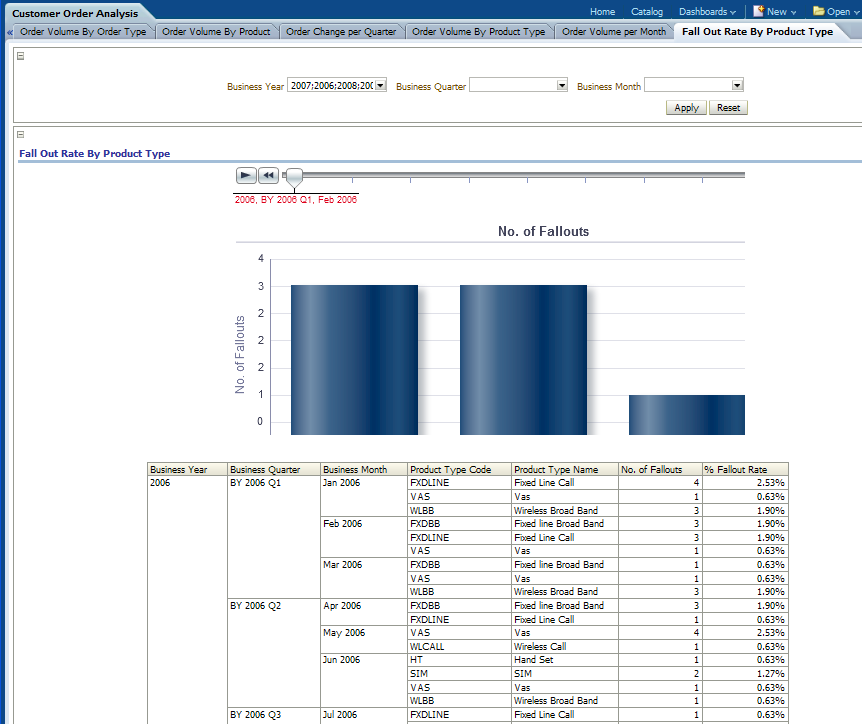
This report, as shown in Figure 12-70 provides business year, business quarter, and business month-level information based on fall out rate by product type.
Report dimensions are:
Business Time
Figure 12-70 Fall Out Rate by Product Type Sample Report
The revenue sample reports show the following areas:
This area includes the reports: Monthly Revenue, Revenue Forecast, Average Revenue per User (ARPU), and Average Revenue per Business Unit.
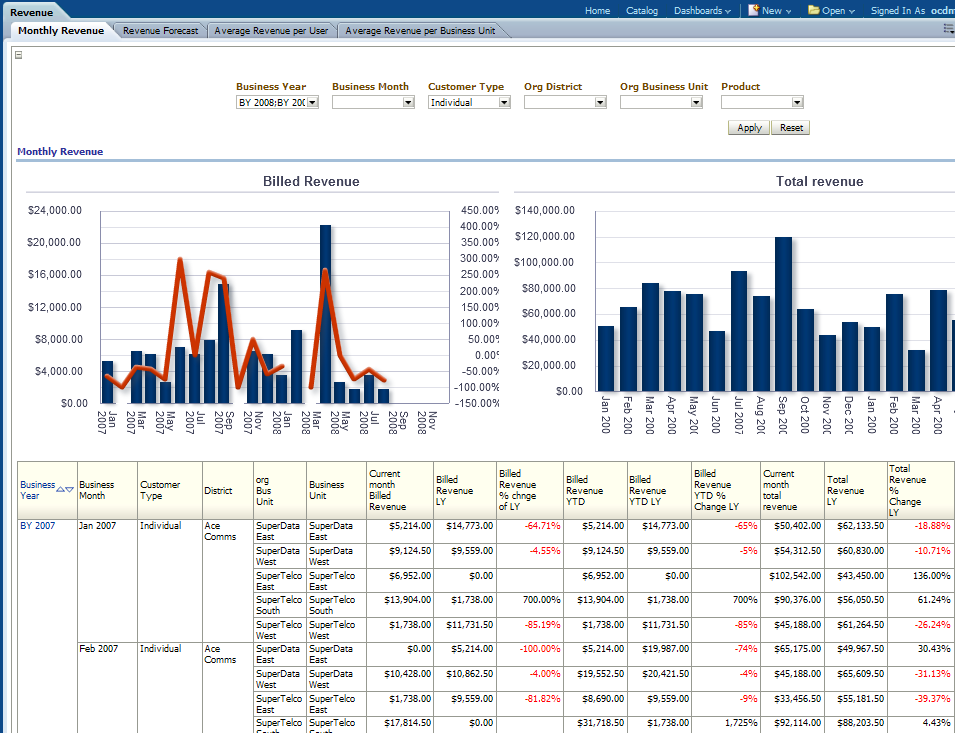
This report, as shown in Figure 12-71 provides month-level transaction activity information based on revenue measures, for one or more organizations and products and for one or more locations.
Report dimensions are:
Business Time
Customer Type
Product
Geography
Organization
Figure 12-71 Monthly Revenue Sample Report
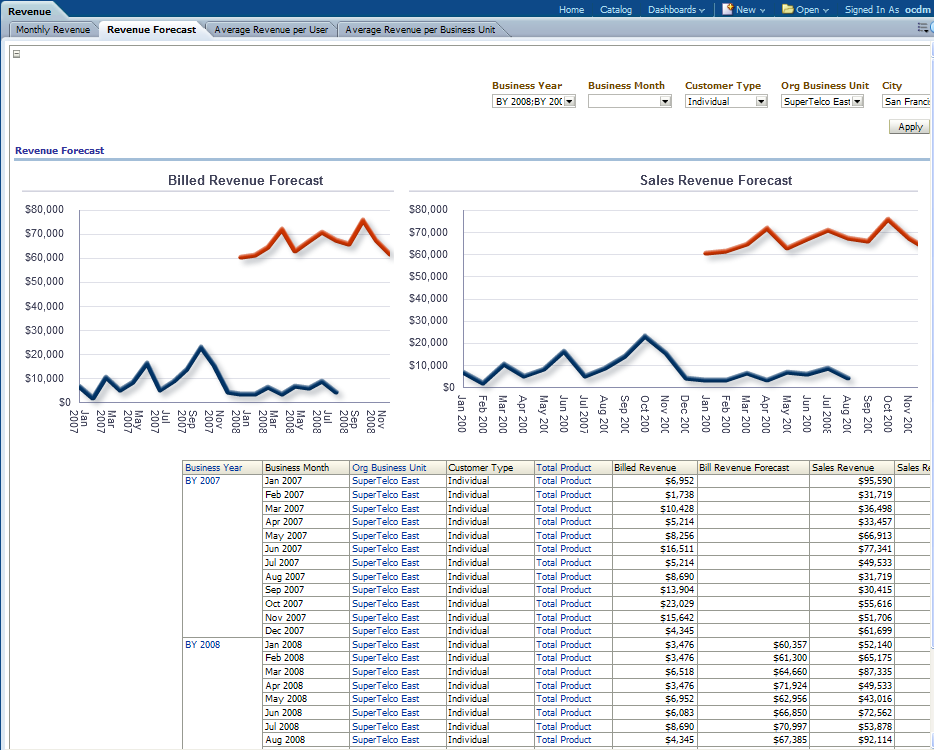
This report, as shown in Figure 12-72 provides month-level transaction activity information based on revenue measures, for one or more locations.
Report dimensions are:
Business Time
Customer Type
Product
Geography
Organization
Figure 12-72 Revenue Forecast Sample Report
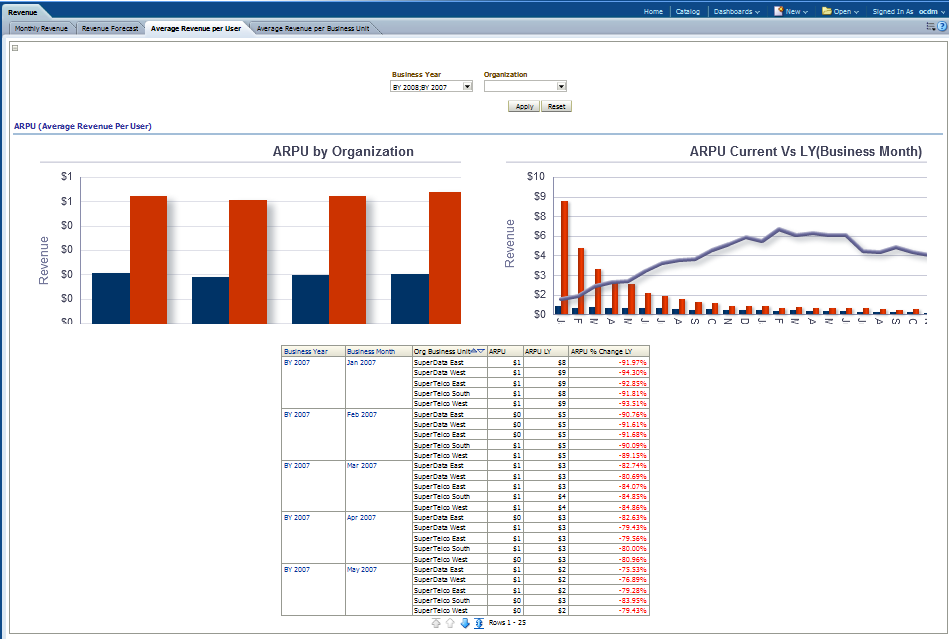
This report, as shown in Figure 12-73 provides month-level transaction activity information based on ARPU measures, for one or more stores and this is a calculation often used to determine the overall value of an application. This report used to generate revenue for a particular customer by comparing someone's account to the overall average.
Report dimensions are:
Business Time
Organization
Figure 12-73 Revenue Average Revenue per User (ARPU) Sample Report
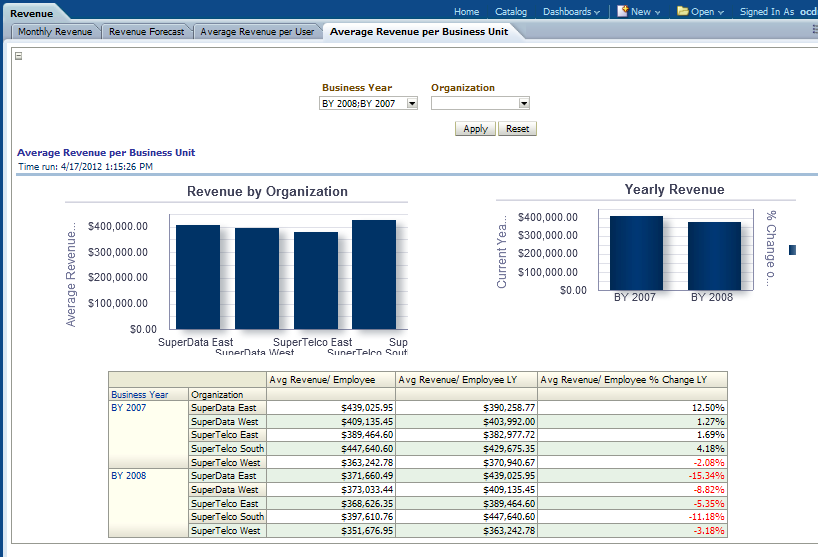
This report, as shown in Figure 12-74 shows the average revenue per Business Unit. The average revenue is calculated as total revenue of that organization divided by the number of employees.
Report dimensions are:
Business Time
Organization
Figure 12-74 Revenue Average Revenue For Business Unit
This area includes the reports: CDR Revenue Compared to Billed Revenue, Percent of Non Billed Revenue, Billable xDRs suspended or errored / the Total xDRs, Invoice Collected and Uncollected, Abnormally High Usage, Minutes of Usage by Call Type, and Revenue Assurance.
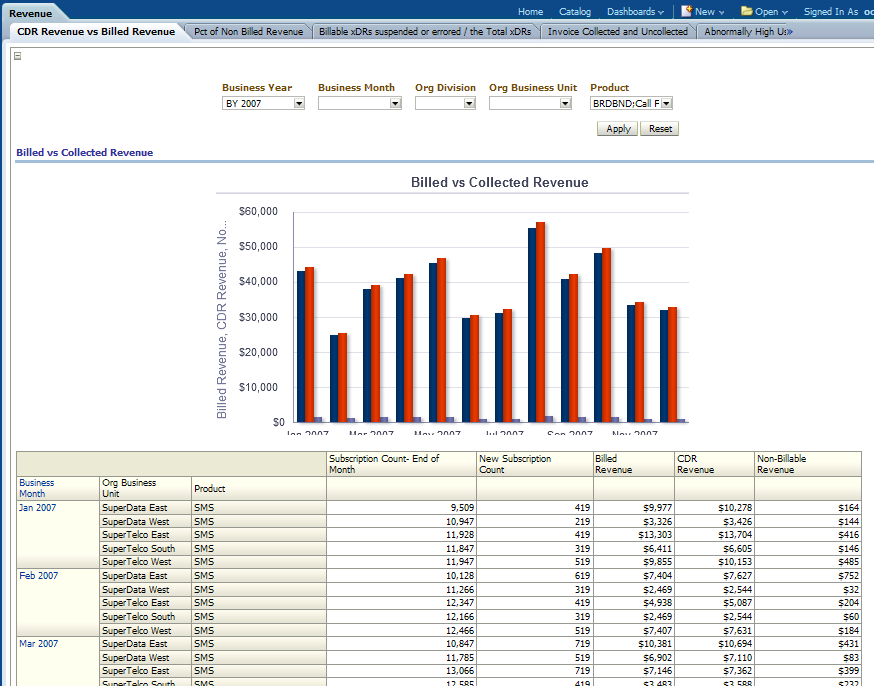
This report, as shown in Figure 12-75 analyzes revenue according to the Network Event CDR, side by side with billed revenue for a product.
Report dimensions are:
Business Time
Organization
Product
Figure 12-75 CDR Revenue Compared to Billed Revenue Sample Report
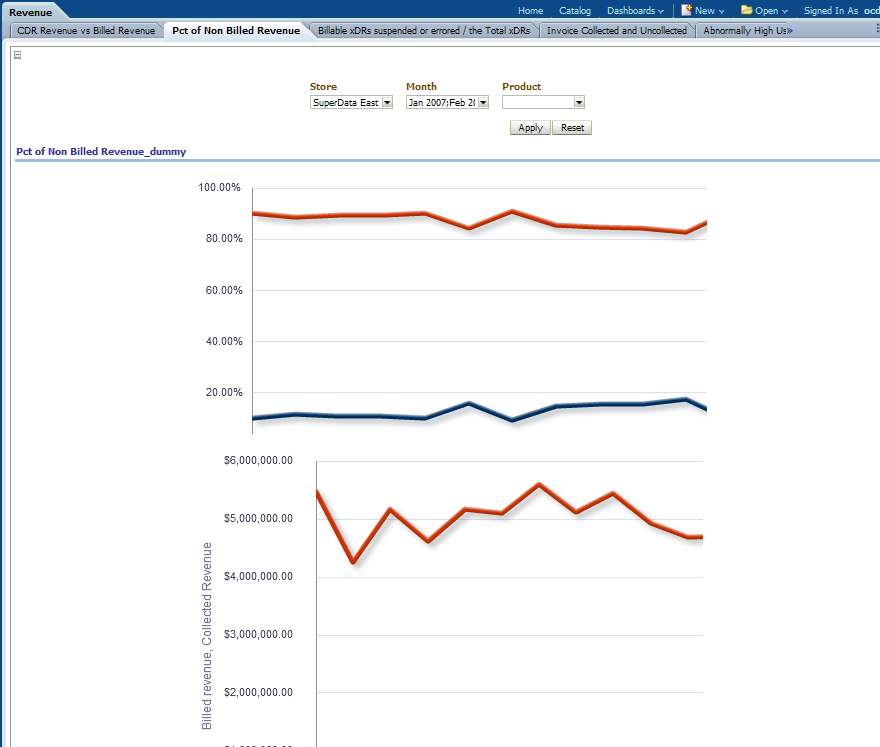
This report, as shown in Figure 12-76 analyzes the percent of Non billed Revenue for a product.
Report dimensions are:
Business Time
Store
Product
Figure 12-76 Percent of Non Billed Revenue Sample Report
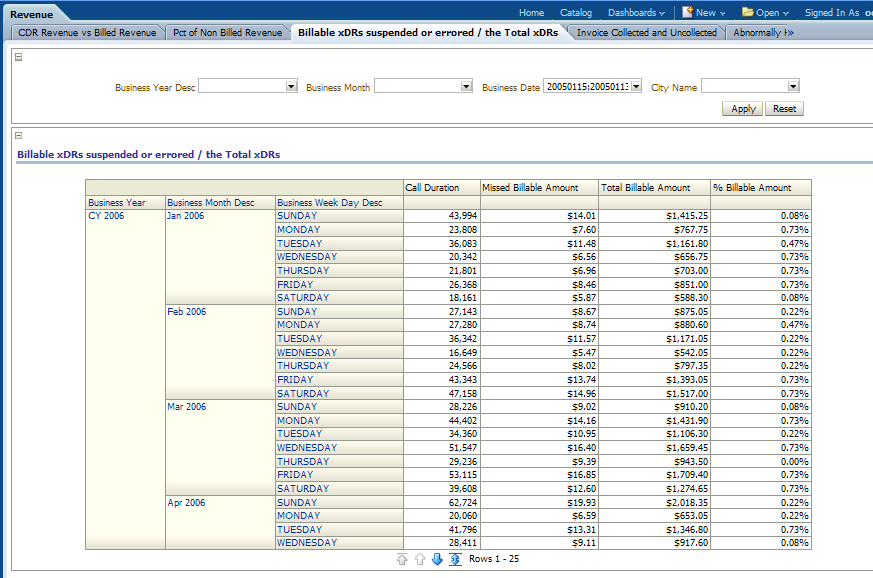
This report, as shown in Figure 12-77 shows analyzes suspended or errored billable xDRs. Those CDRs cannot be billed successfully and cause revenue leakage compared with the total xDRs.
Report dimensions are:
Business Time
Geography
Figure 12-77 Billable xDRs Suspended or Errored Compared to Total xDRs Sample Report
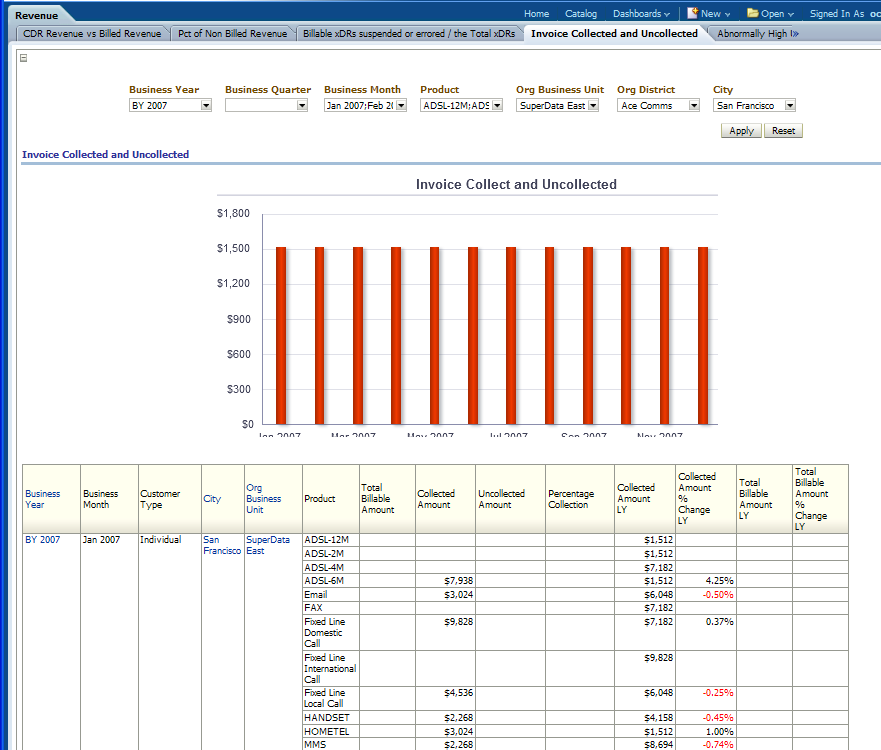
This report, as shown in Figure 12-78 analyzes the collected invoice amount and the uncollected amount for each Month. This is also a way to monitor the revenue leakage.
Report dimensions are:
Business Time
Organization
Customer Type
Geography
Product
Figure 12-78 Invoice Collected and Uncollected Sample Report
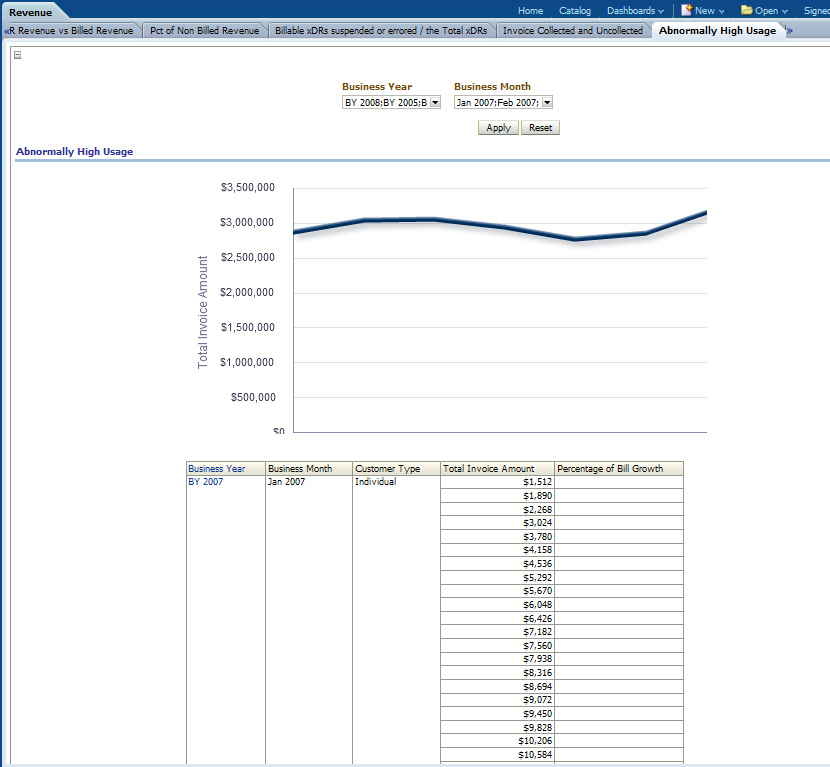
This report, as shown in Figure 12-80 shows Abnormally High Usage; users who have exceeded their previous bills.
Report dimensions are:
Business Time
Customer Type
Figure 12-79 Abnormally High Usage Sample Report
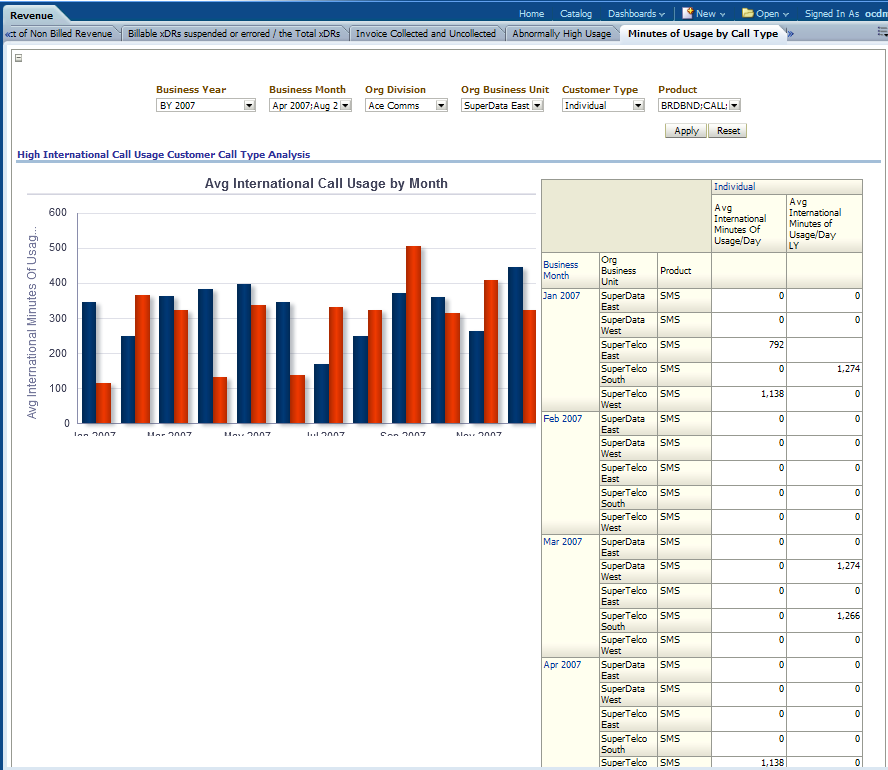
This report, as shown in Figure 12-80 describes minutes of usage per customer. The customers are grouped by their usage pattern, for example, High Local Usage customer are those customers use Local, short distance, calls more than domestic and international calls.
Report dimensions are:
Business Time
Network Element
Figure 12-80 Minutes of Usage Sample by Call Type Sample Report
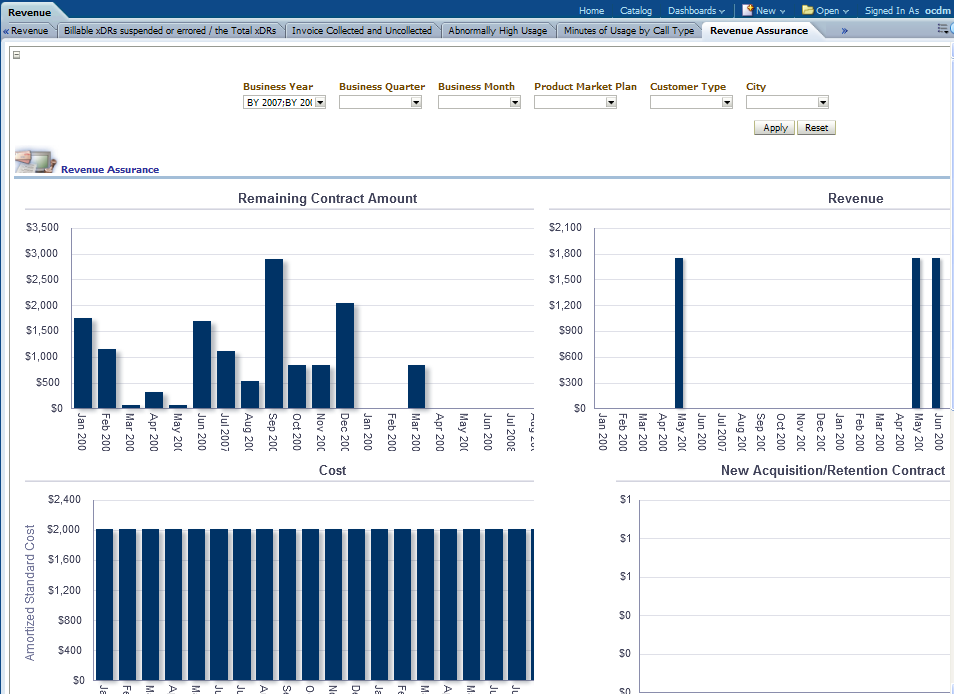
This report, as shown in Figure 12-81 determines how to best to assure that all of the revenue is earned. This is done by analyzing the revenue related information such as Remaining contract SUM, Retention count, and so on.The remaining contract Sum indicates how much revenue can be expected in next six months or one year for a given product or organization business unit.
Report dimensions are:
Business Time
Organization
Product Market Plan
Geography
Figure 12-81 Revenue Assurance Sample Report
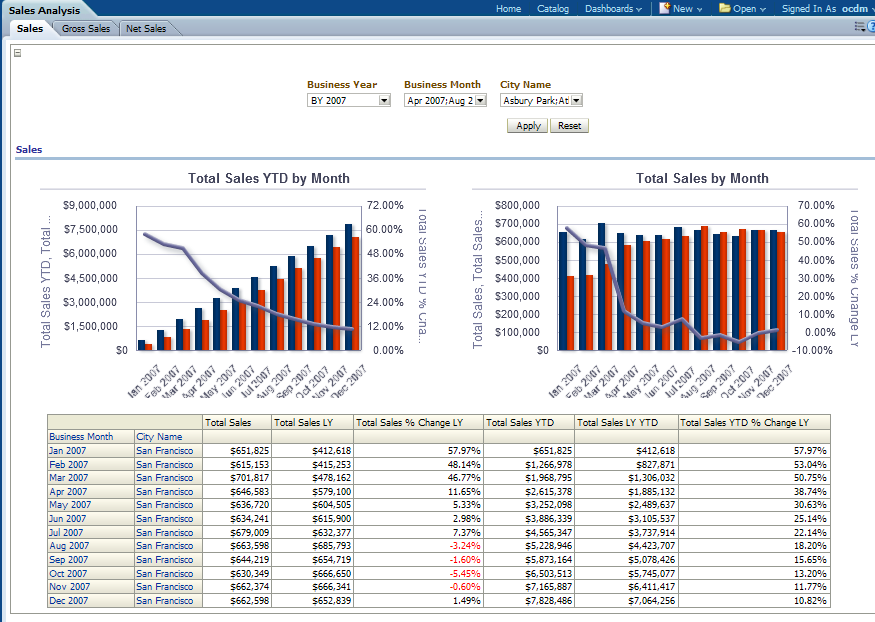
This area includes the reports: Sales, Gross Sales, and Net Sales.
This report, as shown in Figure 12-82 provides month-level sales summary, for one or more locations.
Report dimensions are:
Business Time
Product
Geography
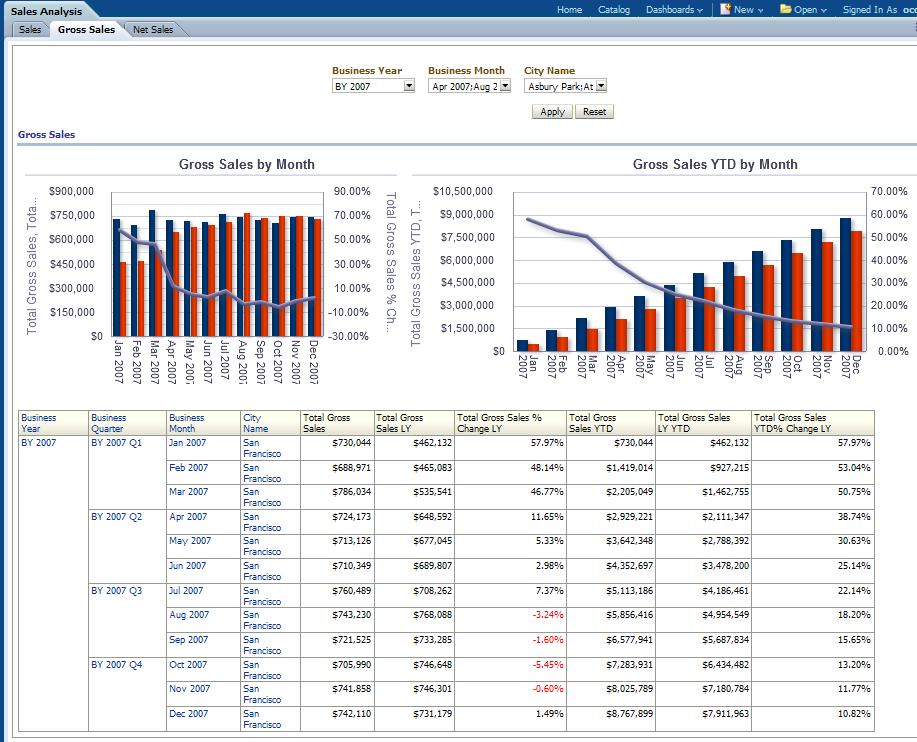
This report, as shown in Figure 12-83 provides month-level sales summary information, for one or more locations.
Report dimensions are:
Business Time
Product
Geography
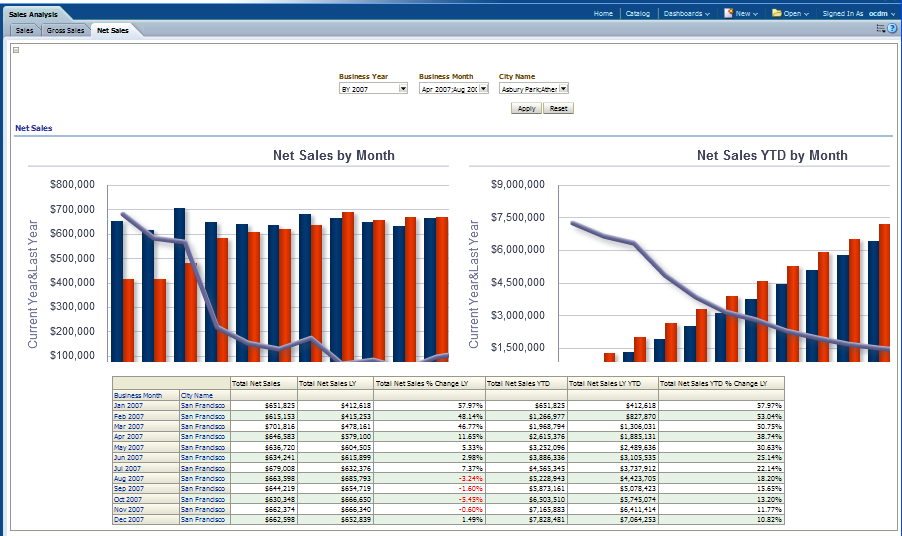
This report, as shown in Figure 12-84 provides month-level net sales summary, for one or more locations. The exact definitions of net sales can be refined by the service operator, while the default definition is the sales amount deducted by the cost of handset, human resources, and so on.
Report dimensions are:
Business Time
Product
Geography
This area includes the reports: Debt Collection, Debt Aging, Percentage of the Recovered Revenue Value, External Debt Collection.
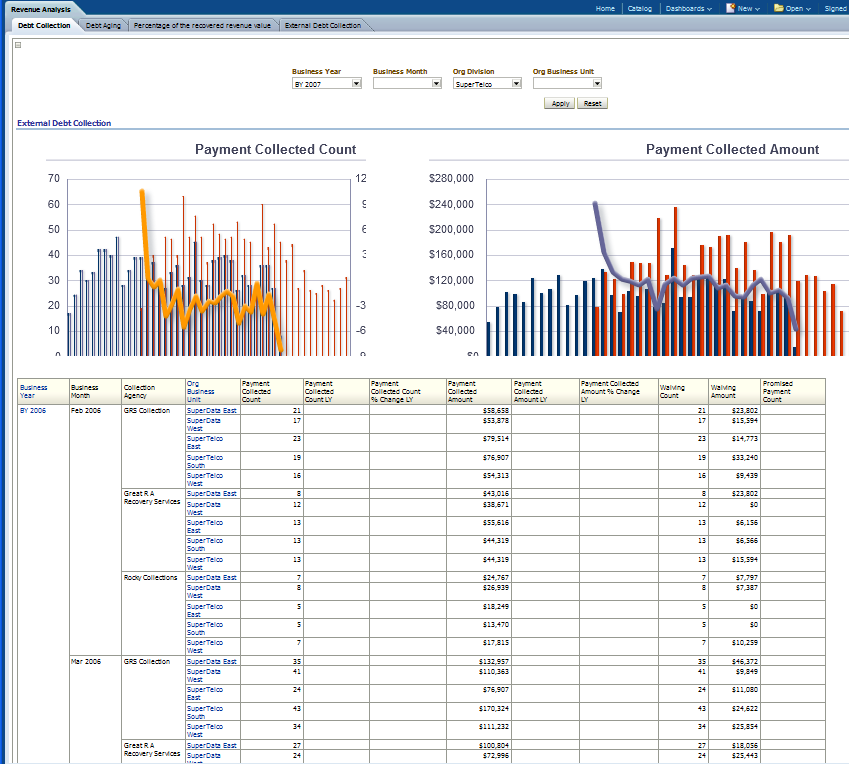
This report, as shown in Figure 12-85 provides month-level collected revenue and the collection count for one or more organization business unit. Only those customer payments collected by internal or external collection agents are deemed as collected revenue.
Report dimensions are:
Business Time
Organization
Figure 12-85 Debt Collection Sample Report
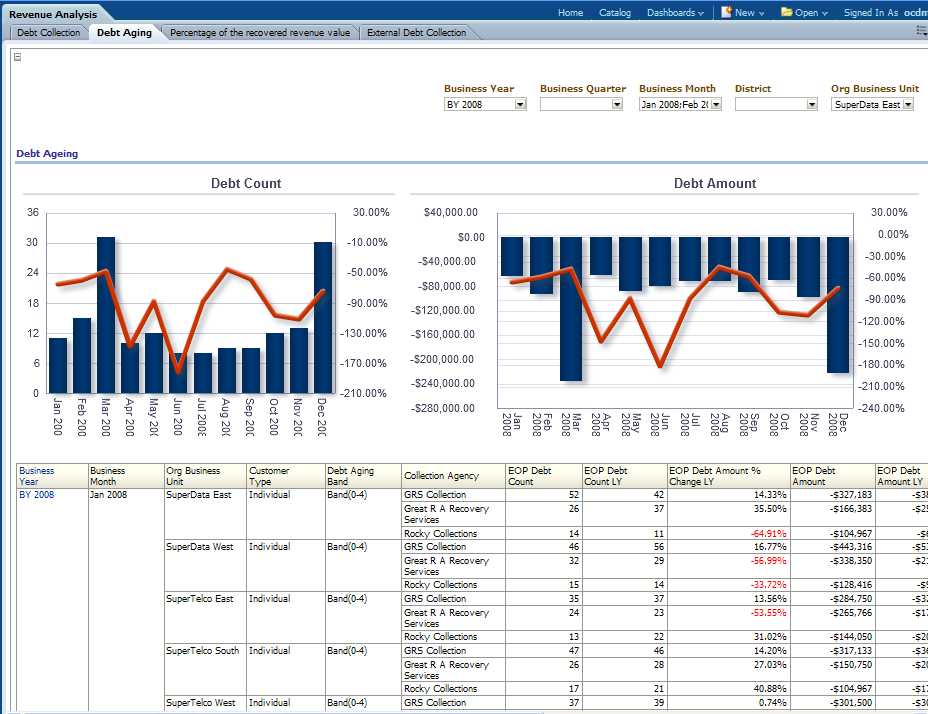
This report, as shown in Figure 12-86 generates debt aging details for the customers currently in debt.
Report dimensions are:
Business Time
Organization
Debt Aging Band
Customer Type
Collection Agency
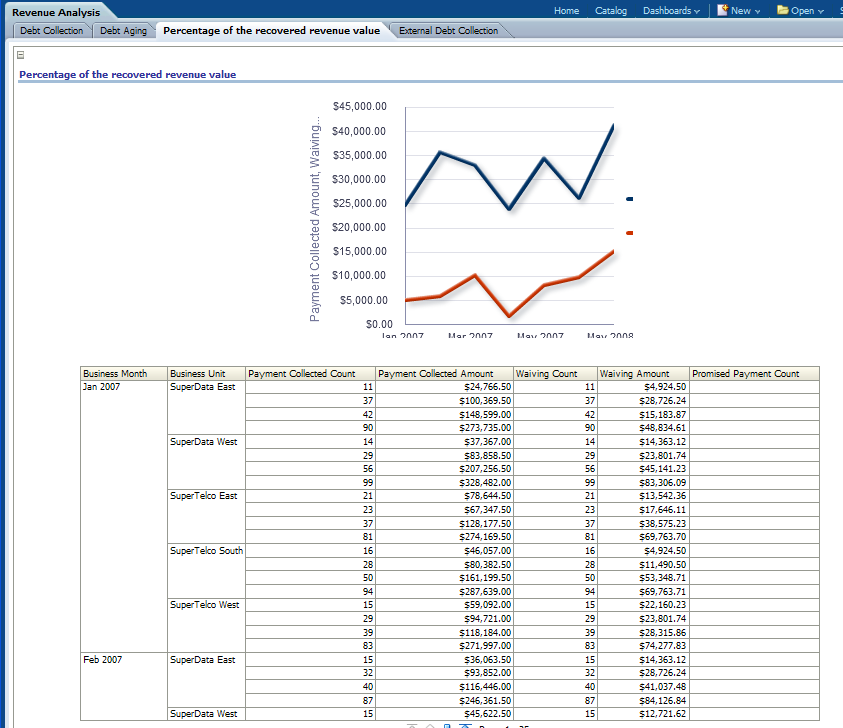
This report, as shown in Figure 12-87 analyzes percentage of the recovered revenue value. After a certain period, if customer still cannot pay the bill, the collection begins. This report can analyze, for all collection amounts, how much is recovered and how much is abandoned.
Report dimensions are:
Business Time
Organization
Collection Agency
Figure 12-87 Percentage of the Recovered Revenue Value Sample Report
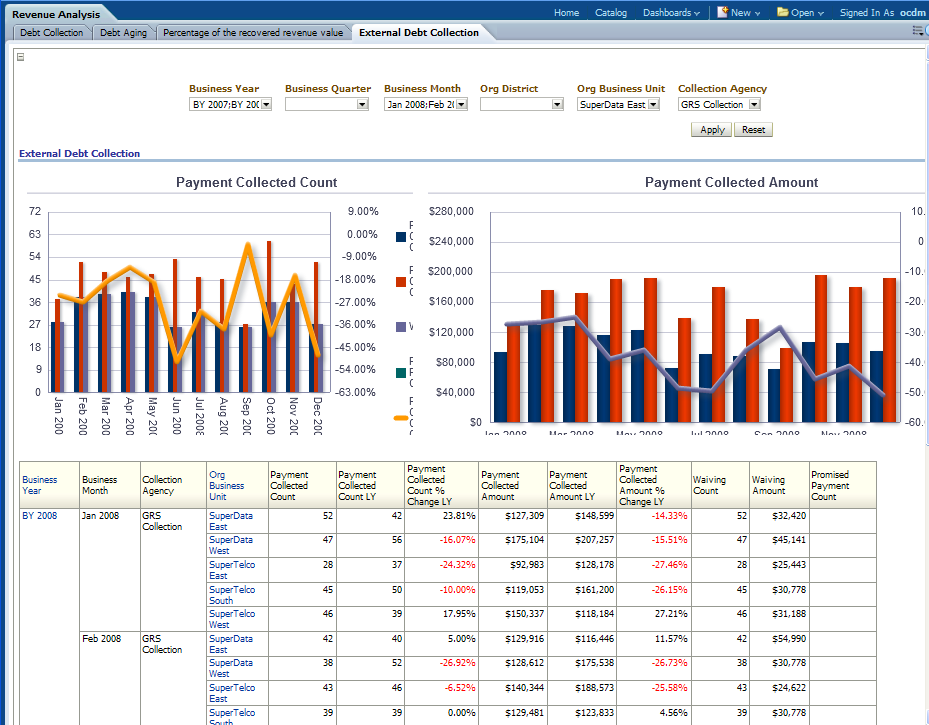
This report, as shown in Figure 12-88 shows collection agency wise Debit collected amount, waiving amount.
Report dimensions are:
Business Time
Organization
Collection Agency
Figure 12-88 External Debt Collection Sample Report
This area includes the reports: Refund to Customer and Invoice Adjustment.
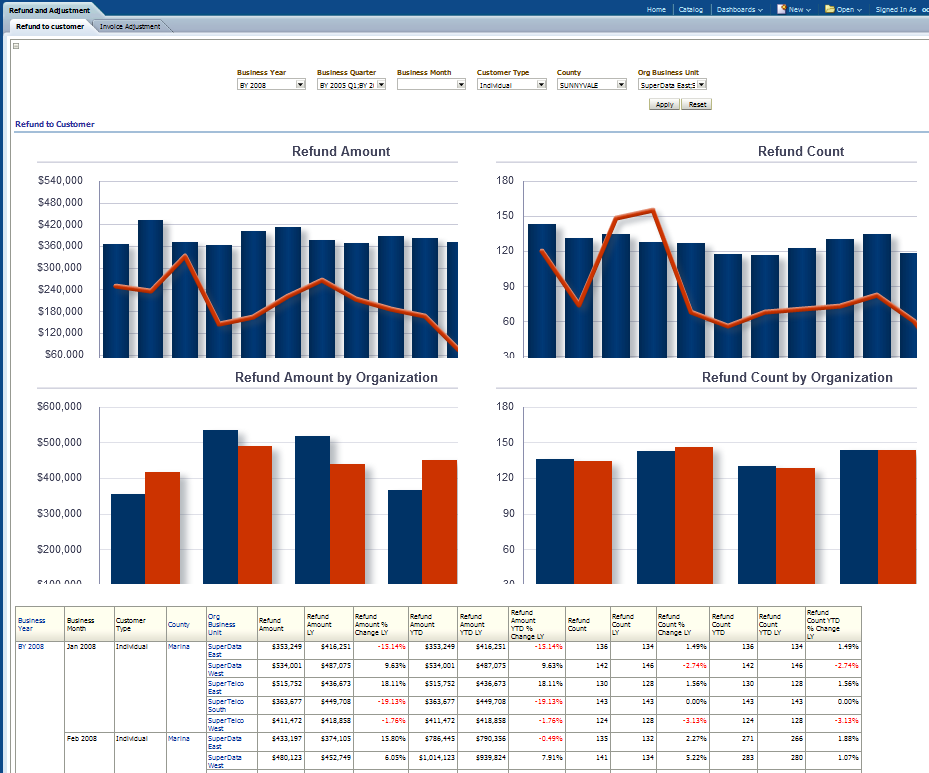
This report, as shown in Figure 12-89 provides summary information about all the refunds made to the customer. for one or more locations.
Report dimensions are:
Business Time
Customer Type
Geography
Organization
Figure 12-89 Refund to Customer Sample Report
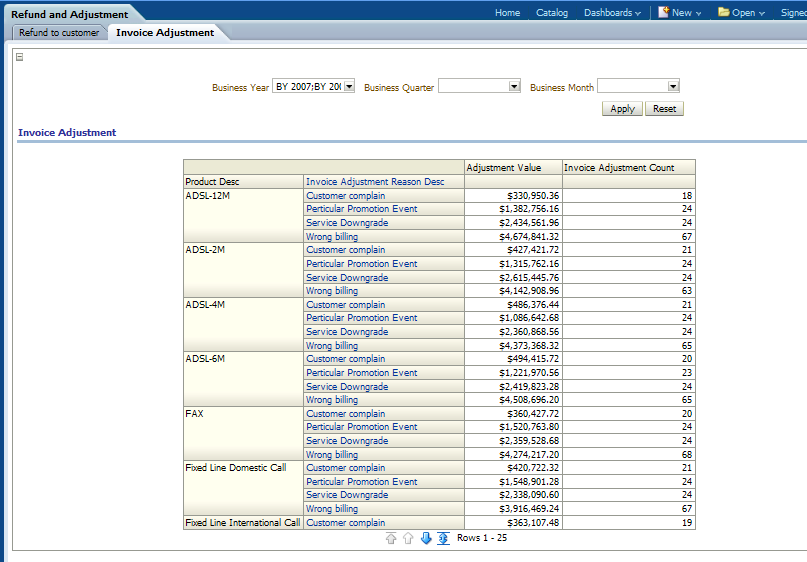
This report, as shown in Figure 12-90 describe adjustment value and count for each product.
Report dimensions are:
Business Time
Product
Figure 12-90 Invoice Adjustment Sample Report
This area includes the reports: Customer Sum of Future Plans, Monthly Future Plan Drop-Out, and Monthly Contract Sum Loss.
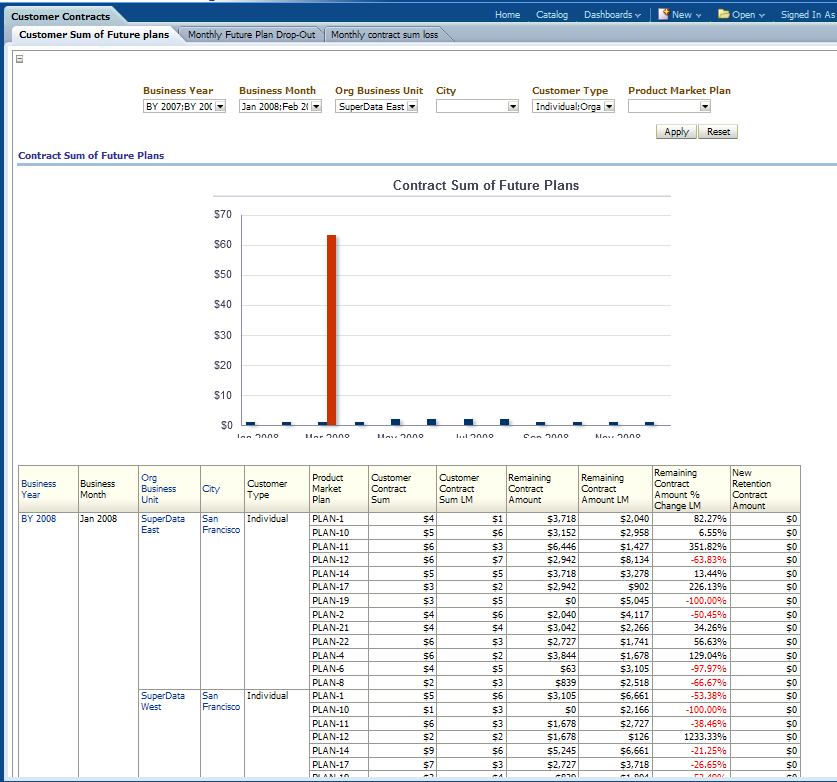
This report, as shown in Figure 12-91 analyzes year and month level contract sum of future plans for the customer type based on LM, % Change LM. The future plan are those contracts customer already signed but not started yet. For example, if today is Feb 20th 2011, and customer may sign a contract starting at Apr 1st 2011 for one year. This is called a Future plan.
Report dimensions are:
Business Time
Organization
Product
Geography
Customer
Figure 12-91 Customer Sum of Future Plans Sample Report
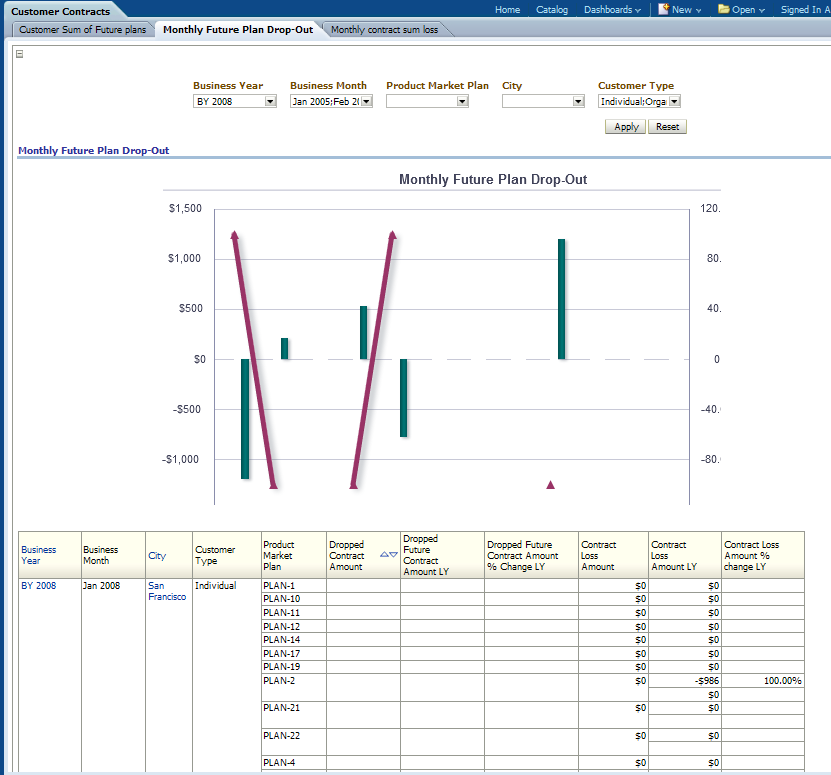
This report, as shown in Figure 12-92 describes product market plan wise dropped contract amount and contract loss amount.
Report dimensions are:
Business Time
Customer Type
Product
Customer
Figure 12-92 Monthly Future Plan Drop-Out Sample Report
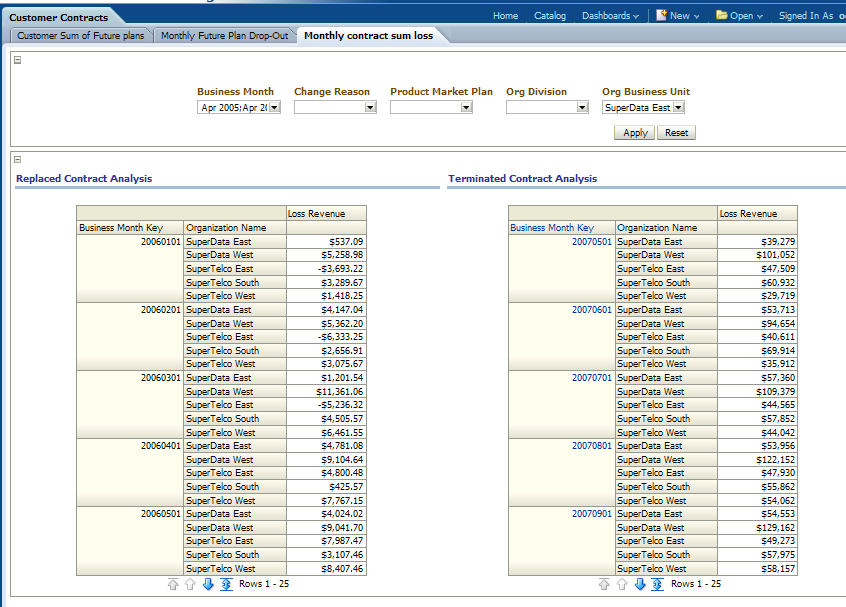
This report, as shown in Figure 12-93 shows month level replaced contract analysis and terminated contract analysis. If a customer downgrades their subscription, for example, using a new USD 186 package to replace original USD286 package, this is deemed as a contract loss in "replaced contract analysis".
Report dimensions are:
Business Time
Organization
Product
Customer
Figure 12-93 Monthly Contract Sum Loss Sample Report
|
Copyright © 2010, 2012, Oracle and/or its affiliates. All rights reserved. Legal Notices |
|