| Oracle® Retail Data Model Reference Release 11.3.1 Part Number E20361-01 |
|
|
PDF · Mobi · ePub |
| Oracle® Retail Data Model Reference Release 11.3.1 Part Number E20361-01 |
|
|
PDF · Mobi · ePub |
This chapter provides additional Oracle Retail Data Model sample reports.
This chapter includes the following sections:
Workforce includes the following areas:
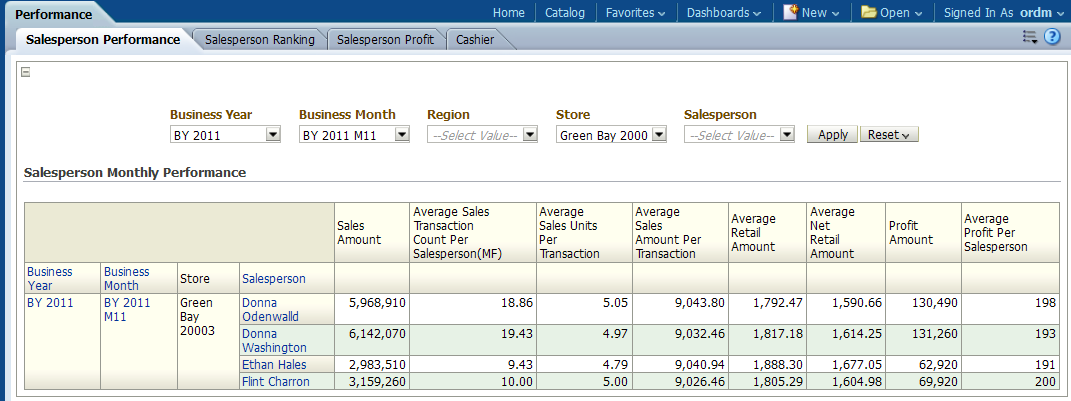
This report, as shown in Figure 13-1 provides monthly performance of sales person using sales measures. The report is used to identify the most or least productive salesperson.
Report dimensions are:
Business Time
Organization
Salesperson
Figure 13-1 Salesperson Monthly Performance Report
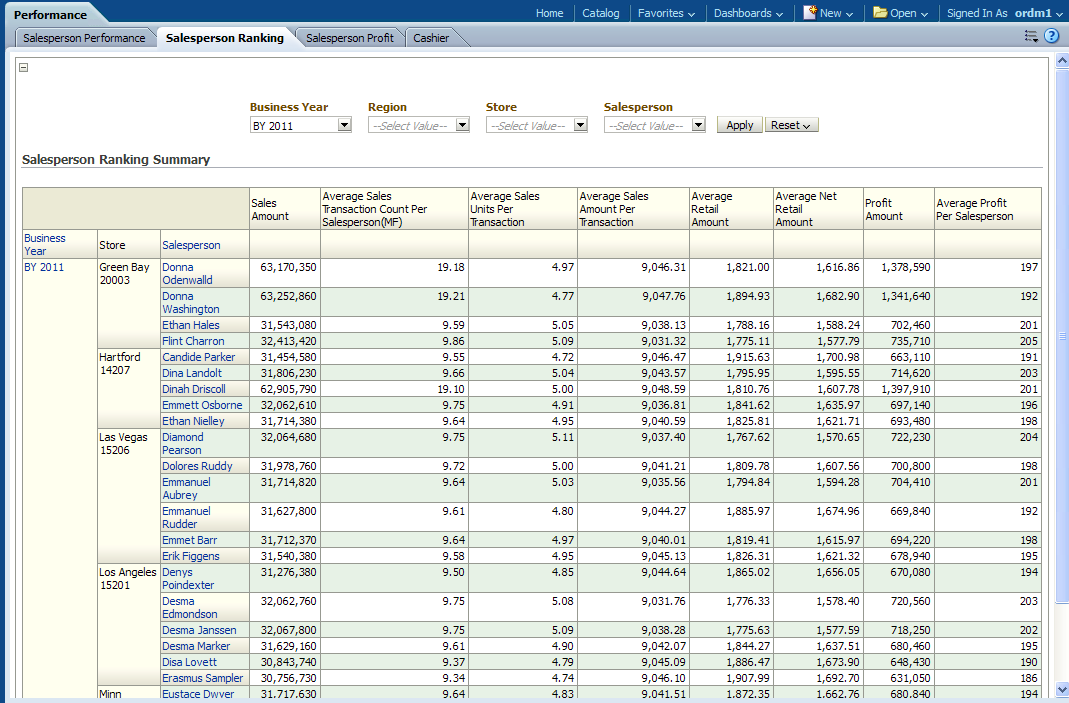
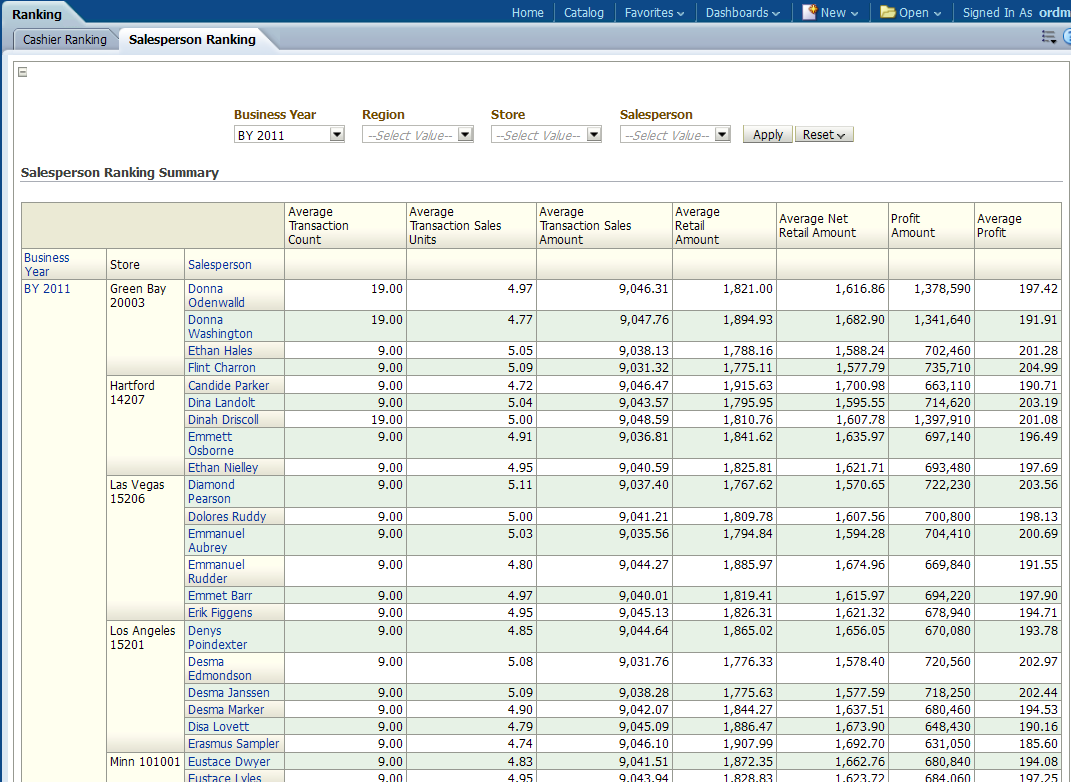
This report, as shown in Figure 13-2 provides salesperson ranking information based on the top sales value for each location. The report is used to identify the most or least productive salesperson in a particular location.
Report dimensions are:
Business Time
Organization
Salesperson
Figure 13-2 Salesperson Ranking Summary Report
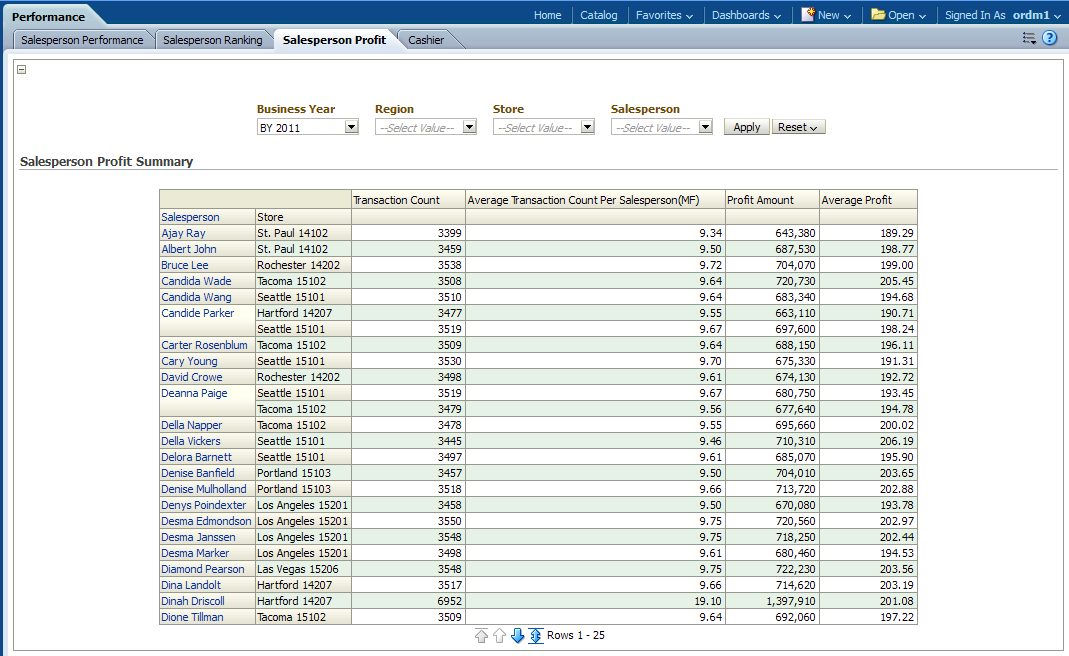
This report, as shown in Figure 13-3 provides salesperson productivity record, based on transaction and profit measures over time.
The report is used to identify the most or least profitable salesperson.
Report dimensions are:
Business Time
Organization
Salesperson
Figure 13-3 Salesperson Profit Summary Report
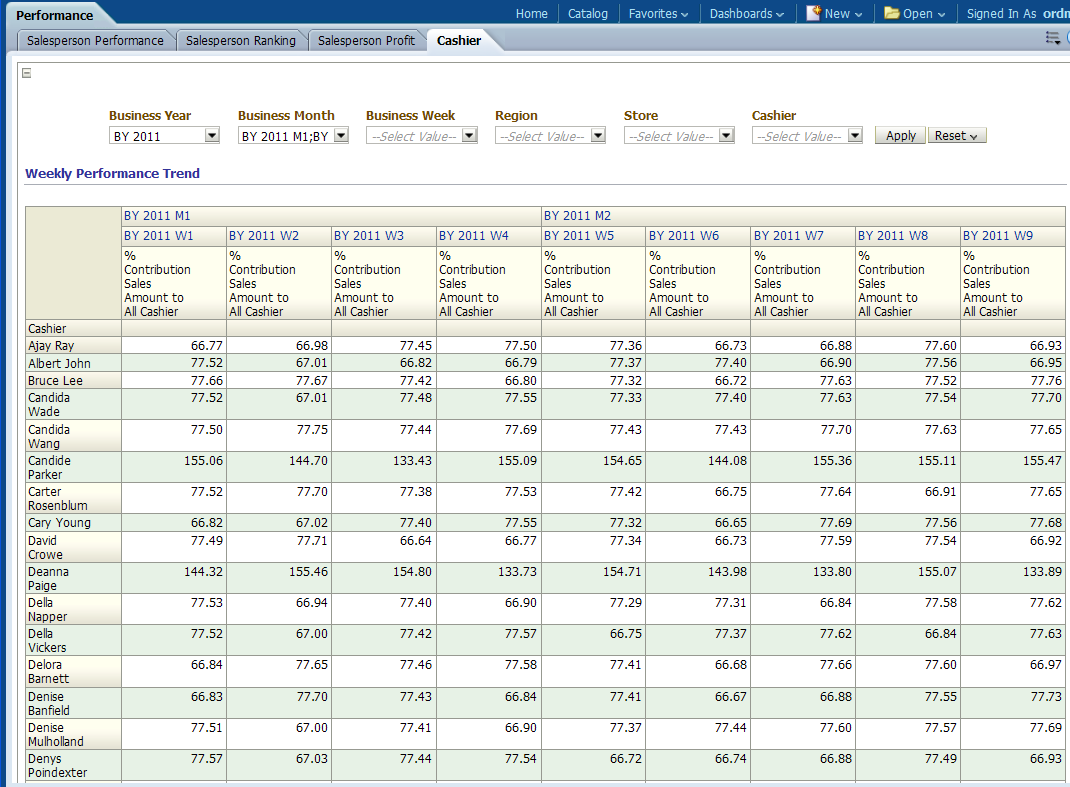
This report, as shown in Figure 13-4 provides contribution of cashiers to all cashiers. The report is used to identify the most or least productive cashiers.
Report dimensions are:
Business Time
Organization
Cashier
Figure 13-4 Cashier Weekly Performance Trend Report
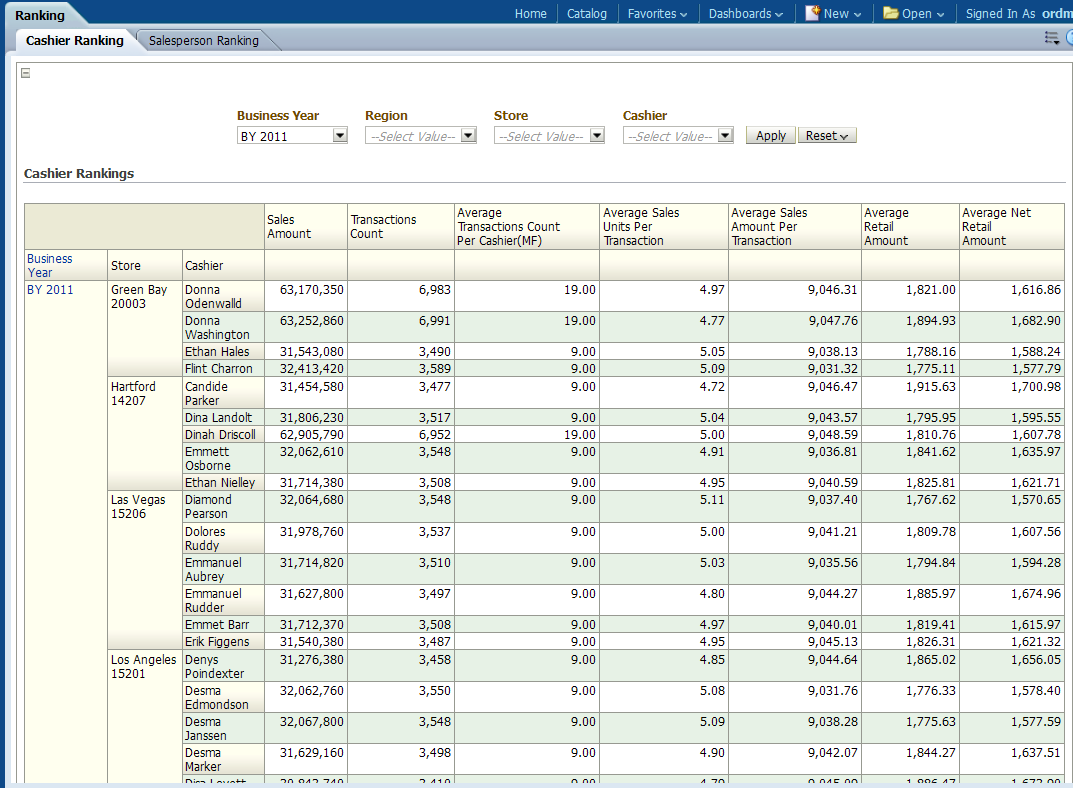
This report, as shown in Figure 13-5 provides cashier ranking information based on the top sales value for each location. The report is used to identify the most or least productive cashiers in a particular location.
Report dimensions are:
Business Time
Organization
Cashier
This report, as shown in Figure 13-6 provides salesperson ranking information based on the top sales value for each location. The report is used to identify the most or least productive cashiers in a particular location.
Report dimensions are:
Business Time
Organization
Salesperson
Figure 13-6 Salesperson Ranking Summary Report
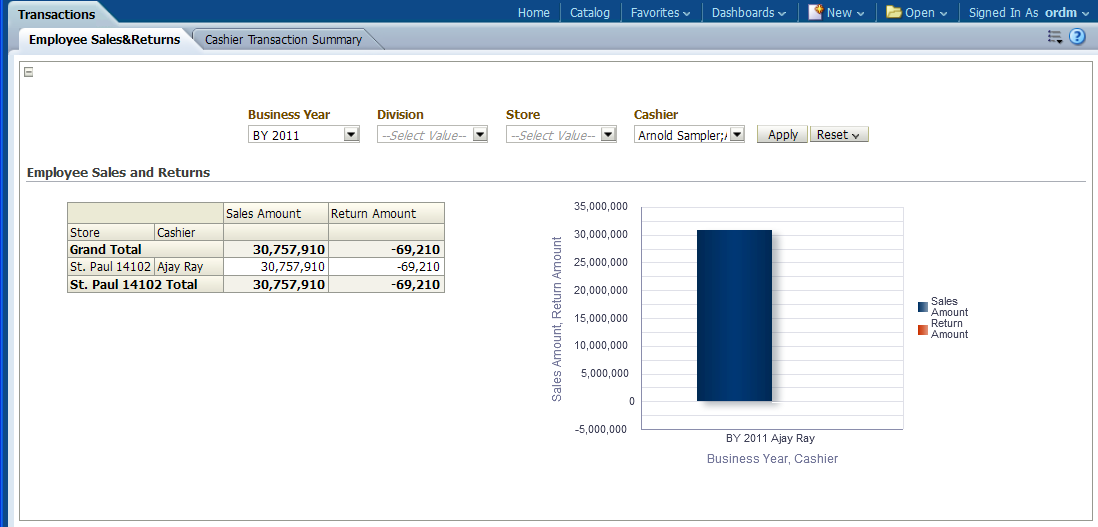
This report, as shown in Figure 13-7 provides sales and return measures by location and employee.
Report dimensions are:
Business Time
Organization
Cashier
Figure 13-7 Employee Sales and Returns Report
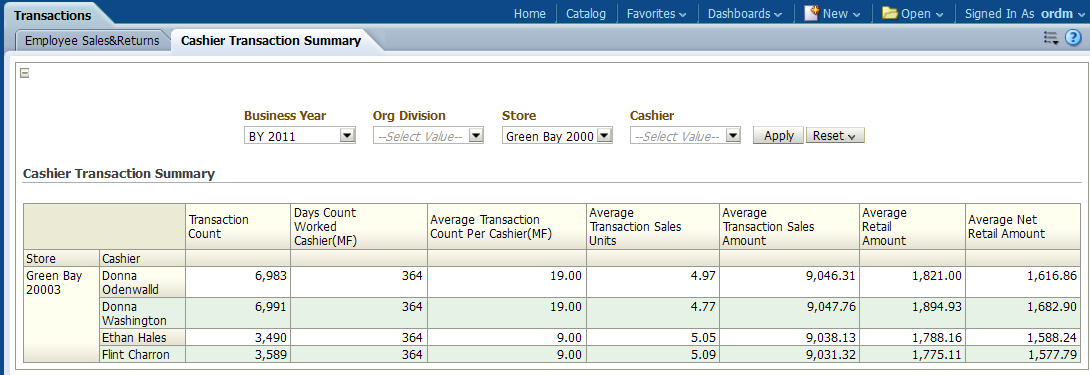
This report, as shown in Figure 13-8 provides cashier productivity information based on sales measures and transaction activity over time. The report is used to identify the most or least productive cashiers.
Report dimensions are:
Business Time
Organization
Cashier
Figure 13-8 Cashier Transaction Summary Report
The points of service reports include the following areas:
This report, as shown in Figure 13-9 provides the purchase rate per visits for store by year, Quarter and Month.
Report dimensions are:
Business Time
Organization
This report, as shown in Figure 13-10 provides the yearly or quarterly moving of sales for various stores.
Report dimensions are:
Business Time
Organization
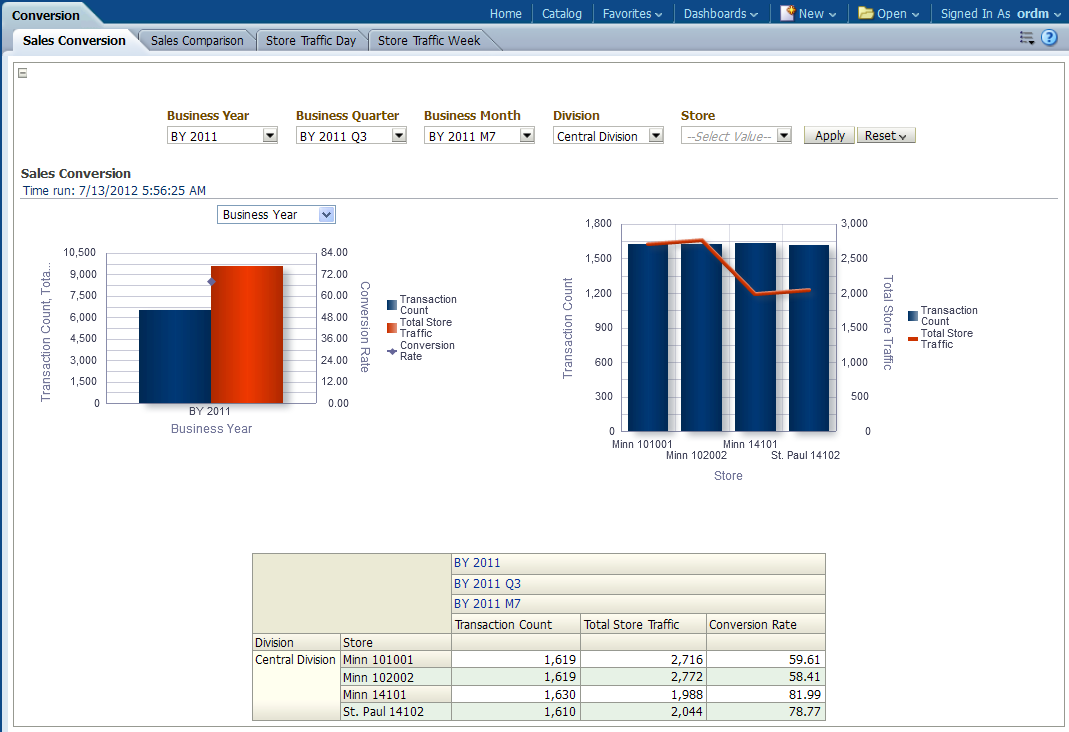
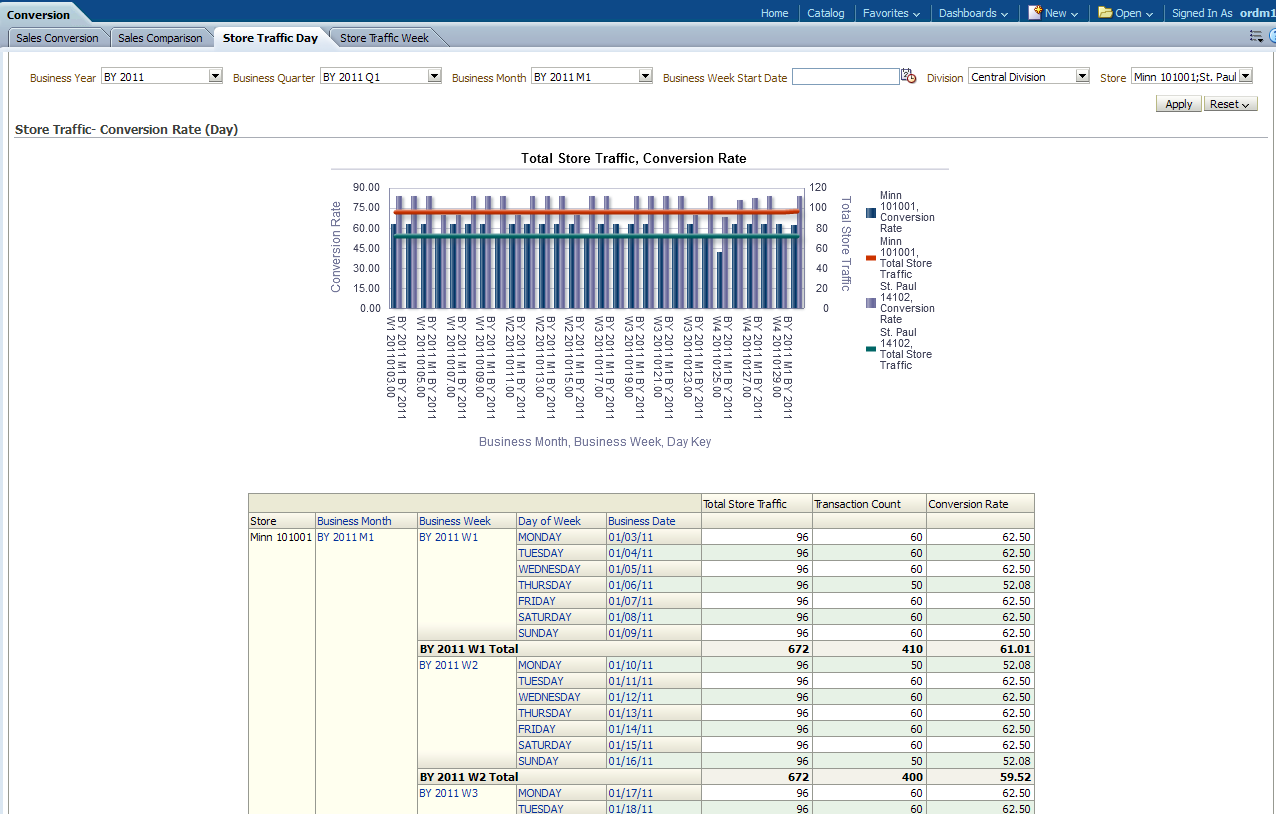
This report, as shown in Figure 13-11 provides the Daily transaction activity based on store traffic measure for one or more division.
Report dimensions are:
Business Time
Organization
Figure 13-11 Store Traffic-Conversion Rate (Day) Report
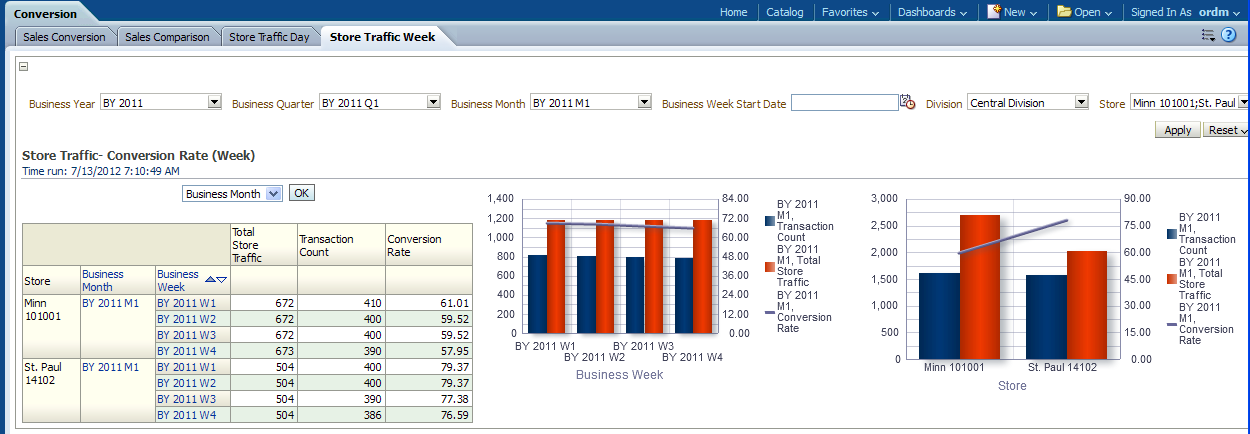
This report, as shown in Figure 13-12 provides the weekly transaction activity based on store traffic measure for one or more division.
Report dimensions are:
Business Time
Organization
Figure 13-12 Store Traffic-Conversion Rate (Week) Report
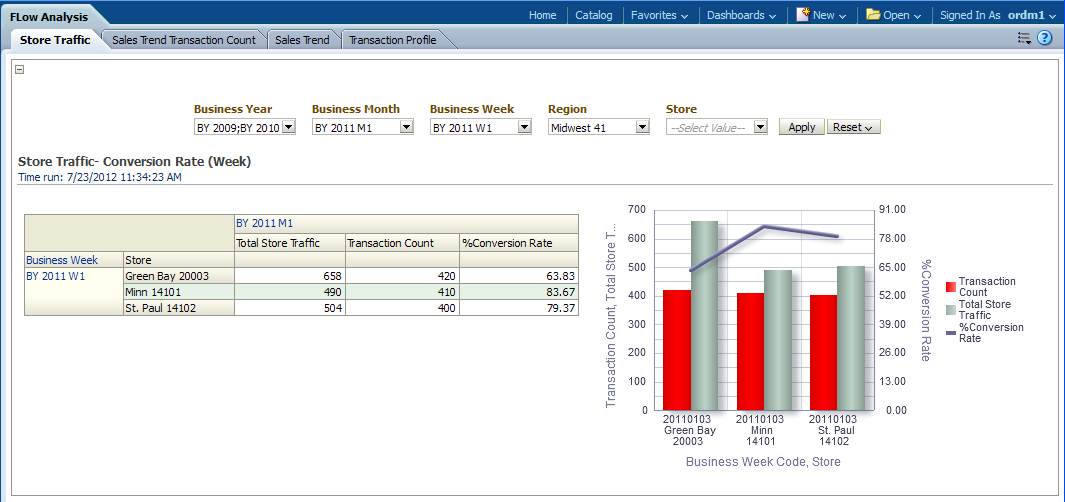
This report, as shown in Figure 13-13 provides the weekly transaction activity information based on store traffic measure for one or more store.
Report dimensions are:
Business Time
Organization
Figure 13-13 Store Traffic Communication Rate (Week) Report
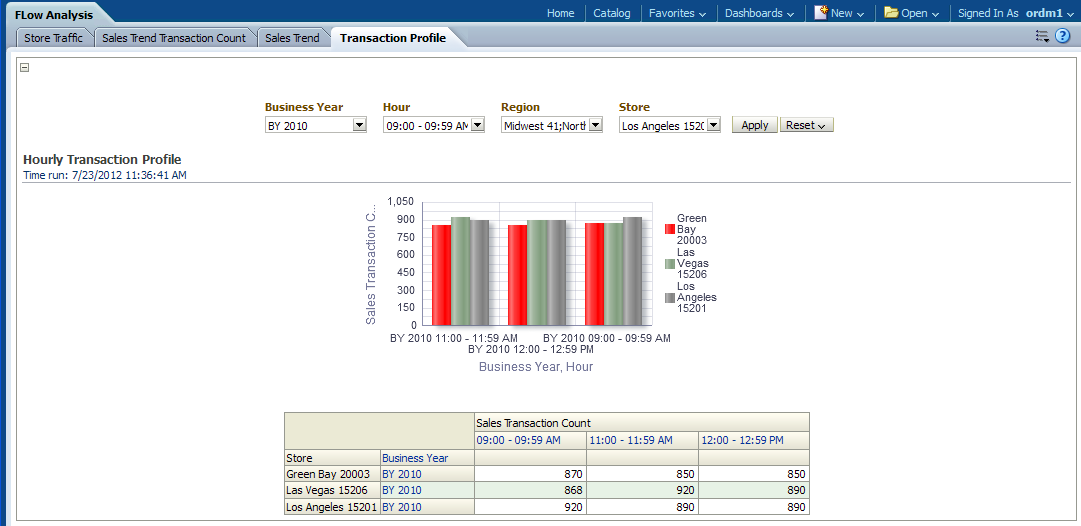
This report, as shown in Figure 13-14 provides hourly store traffic information based on no of sales transaction activity at a store.
Report dimensions are:
Business Time
Organization
Time of Day
Figure 13-14 Hourly Transaction Profile Report
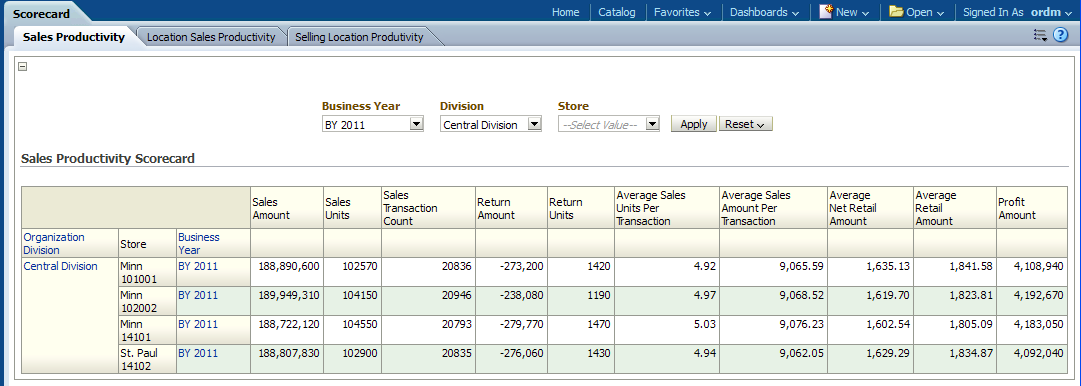
This report, as shown in Figure 13-15 provides the total number of transaction sales units sold hourly, at a location. It also used to identify the most or least productive location.
Report dimensions are:
Business Time
Organization
Figure 13-15 Sales Productivity Scorecard Report
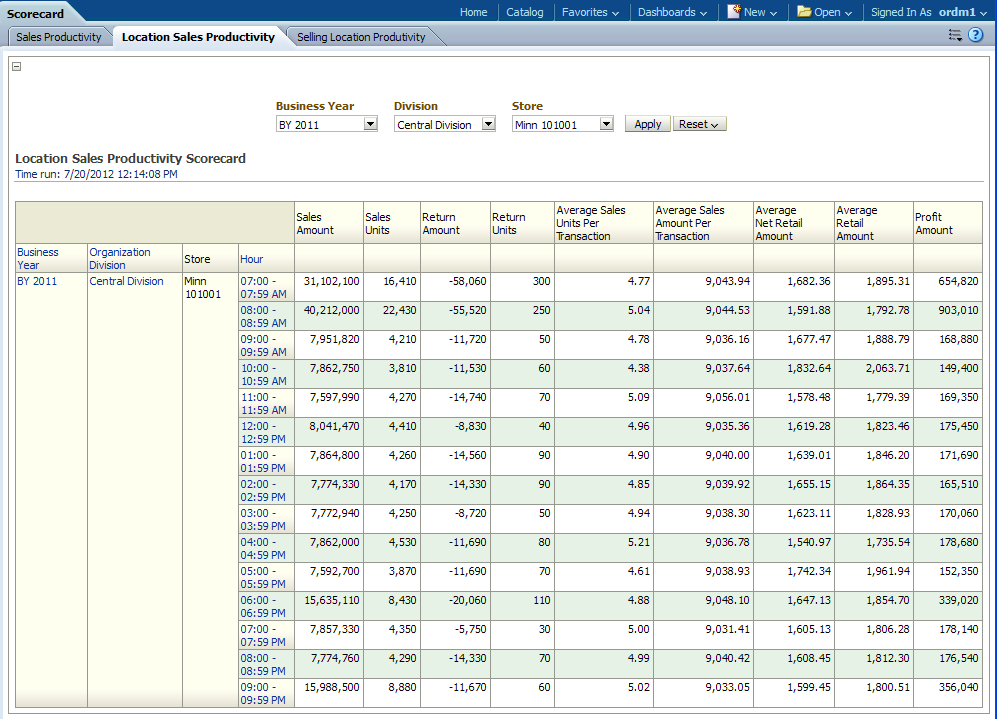
This report, as shown in Figure 13-16 provides by store, hourly sales details based on sales measures.
Report dimensions are:
Business Time
Organization
Time of Day
Figure 13-16 Location Sales Productivity Scorecard Report
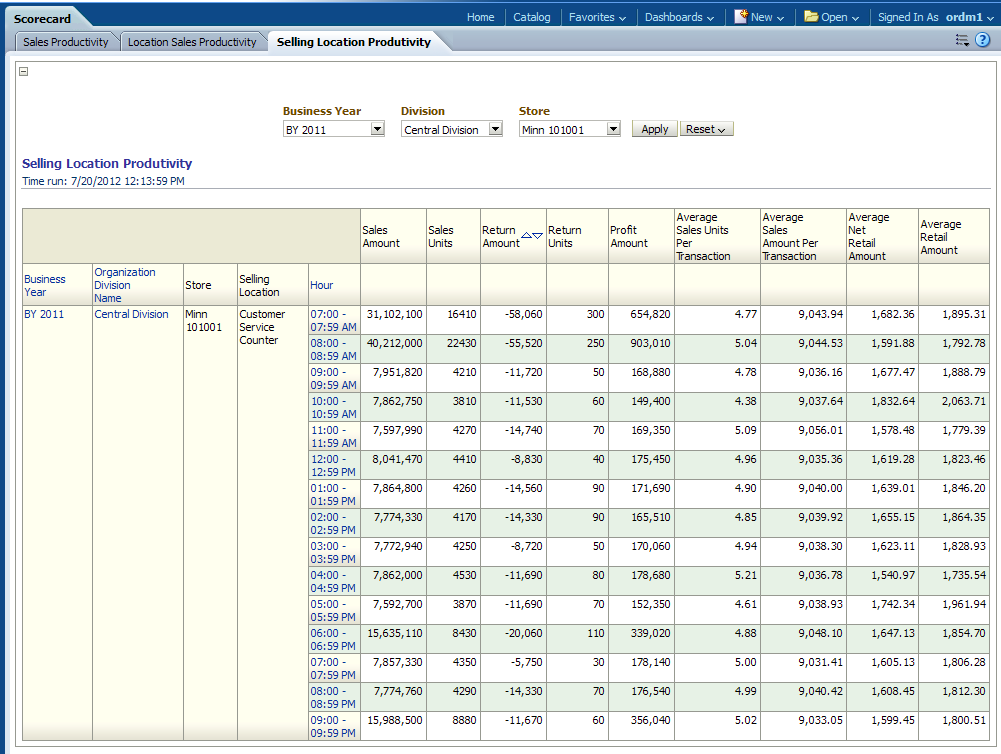
This report, as shown in Figure 13-17 provides business Unit productivity information based on sales measures for one or more locations by register and hours.
Report dimensions are:
Business Time
Organization
Time of Day
Figure 13-17 Selling Location Productivity Scorecard Report
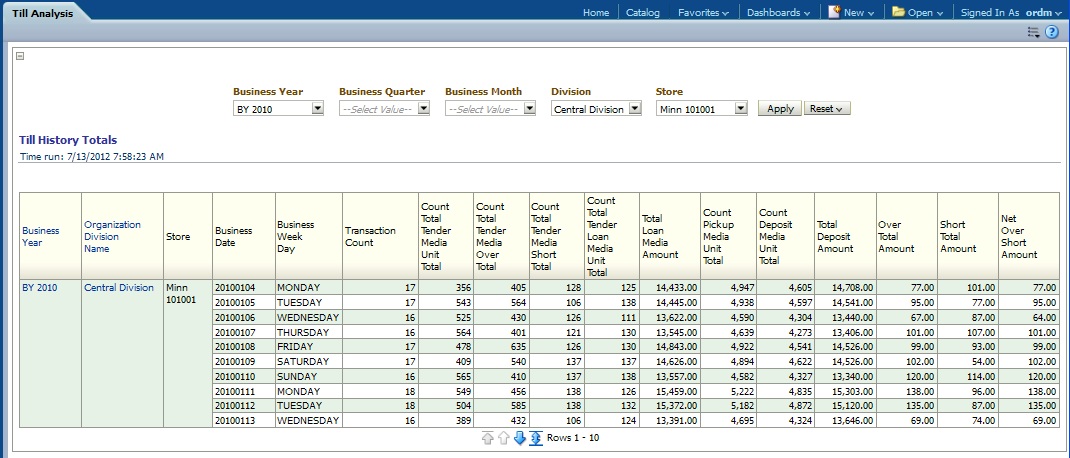
This report, as shown in Figure 13-18 provides various sales audit total values by store, day and week.
Report dimensions are:
Business Time
Organization
Till Tender
Transactions area includes the following reports: Transaction by Associates, and Transaction Profile.
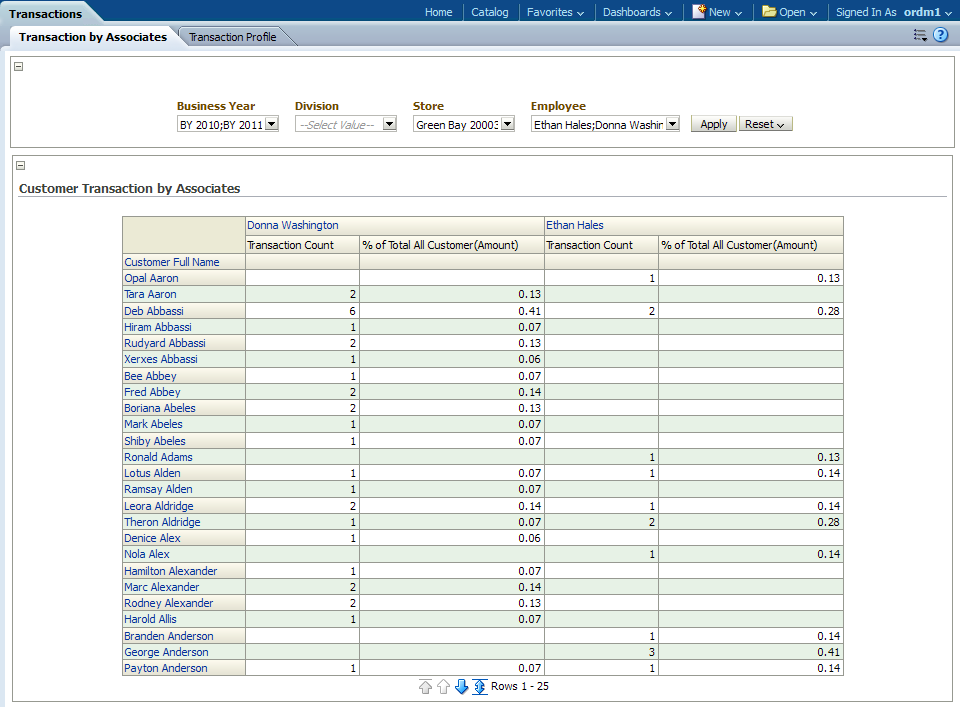
This report, as shown in Figure 13-19 provides the summary of customer transaction and identifying exceptional no. of transactions between an associate and customer for a particular store.
Report dimensions are:
Business Time
Organization
Employee
Customer
Figure 13-19 Customer Transaction by Associates Report
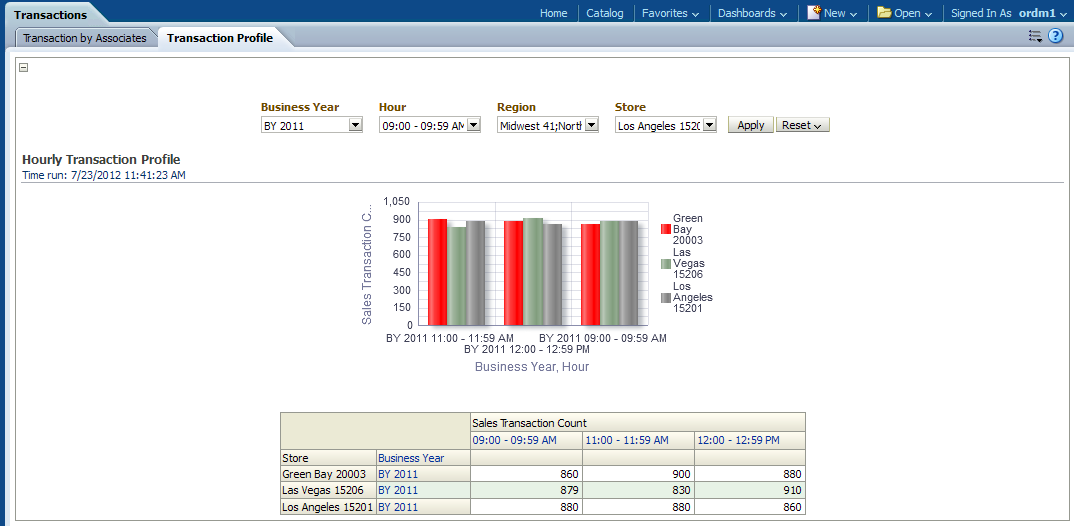
This report, as shown in Figure 13-20 provides hourly store traffic information based on of sales transaction.
Report dimensions are:
Business Time
Organization
Time of Day
Figure 13-20 Hourly Transaction Profile Report
The Loss Prevention reports include the following areas:
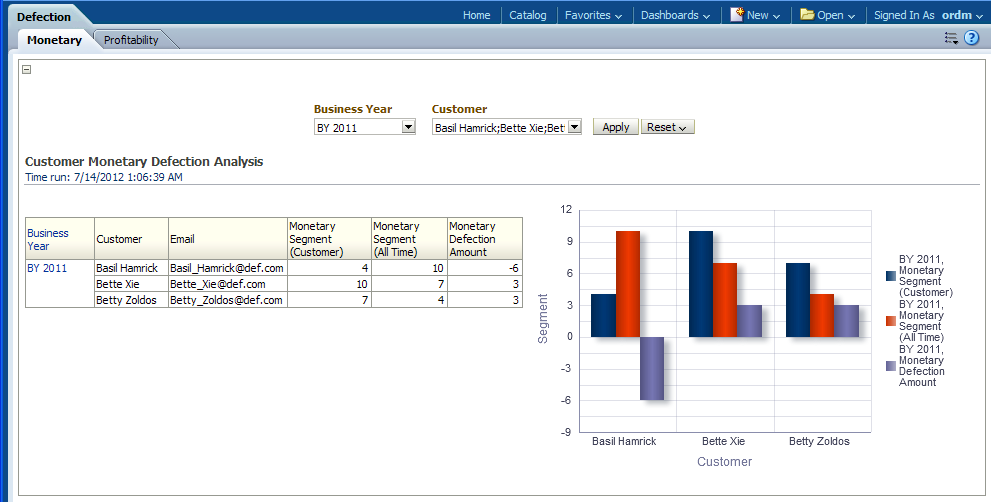
Defection area includes the following reports: Monetary and Profitability.
This report, as shown in Figure 13-21 provides the year level "Customer Monetary Defection Analysis" information for each customer.
Report dimensions are:
Business Time
Customer
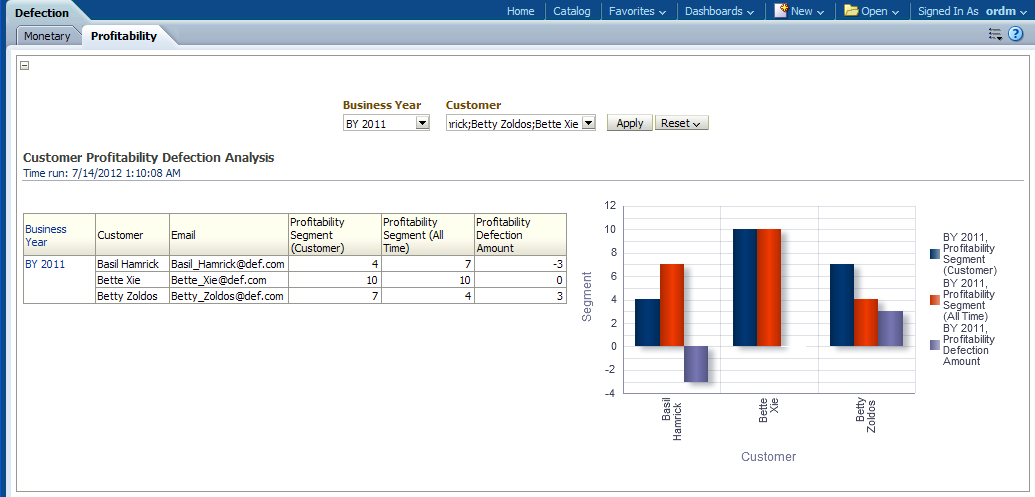
This report, as shown in Figure 13-22 provides the year level "Customer Profitability Defection Analysis" information for each customer.
Report dimensions are:
Business Time
Customer
Figure 13-22 Defection Profitability Report
Shrink and Theft area includes the following reports: Department Trending, and Transaction by Tender.
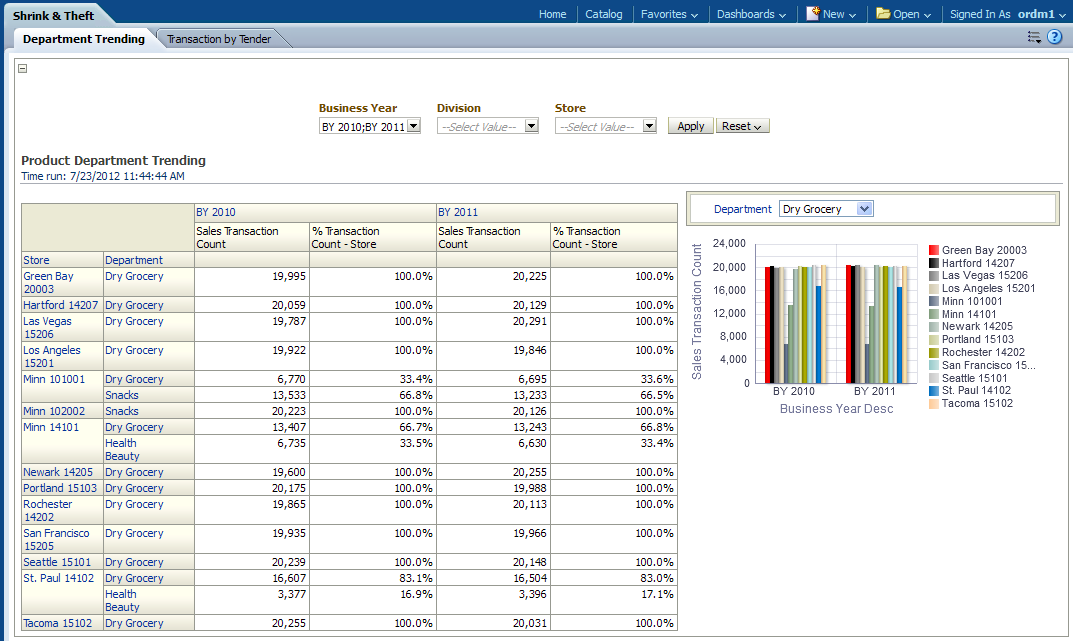
This report, as shown in Figure 13-23 provides product department trending information.
Report dimensions are:
Business Time
Organization
Product
Figure 13-23 Department Trending Shrink and Theft Report
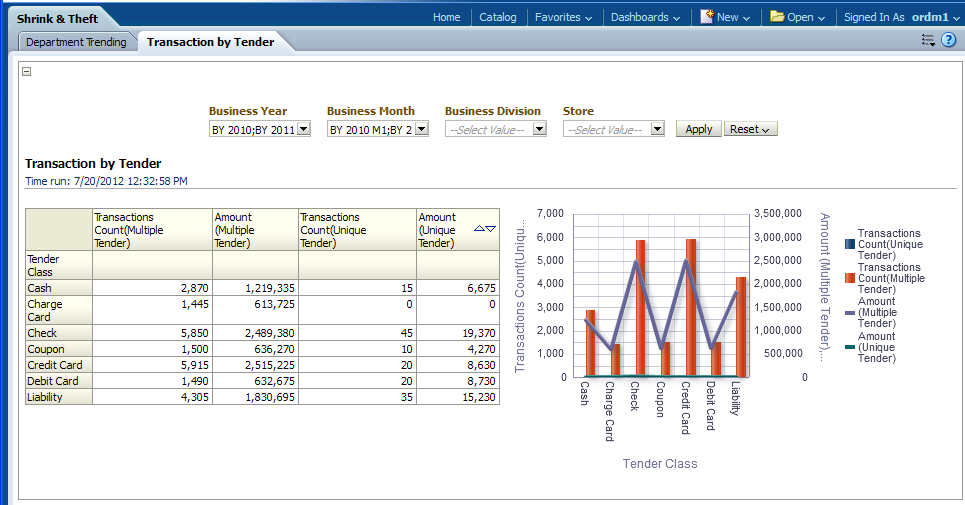
This report, as shown in Figure 13-24 provides the month level "Transaction" information for each organization division, store and tender.
Report dimensions are:
Business Time
Organization
Tender
Figure 13-24 Transaction by Tender Report
Statistical Outliers area includes the following reports: Statistical Emp Outlier and Statistical Store Outlier.
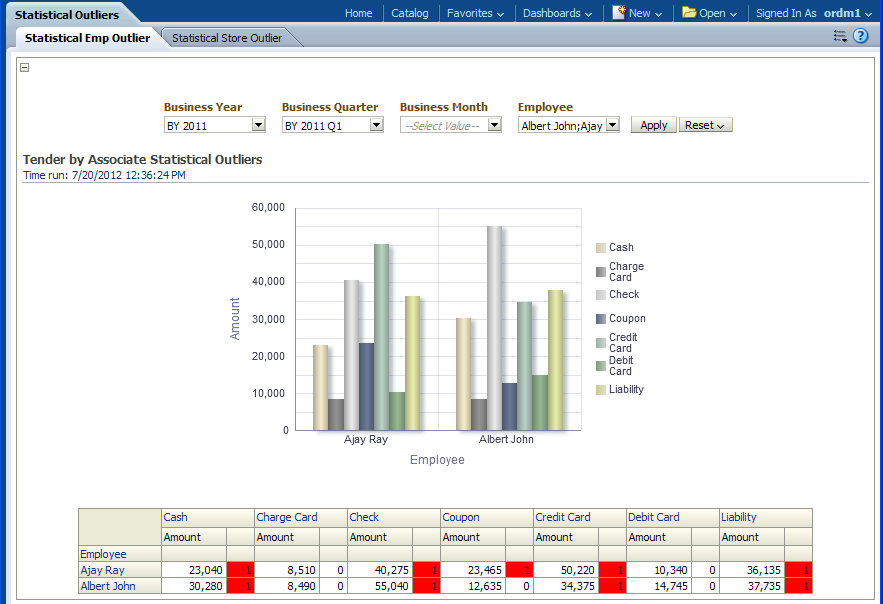
This report, as shown in Figure 13-25 provides the month and quarter level "Associate Statistical Outlier" information for each organization store, employee and tender.
Report dimensions are:
Business Time
Organization
Tender
Employee
Figure 13-25 Statistical Emp Outlier Report
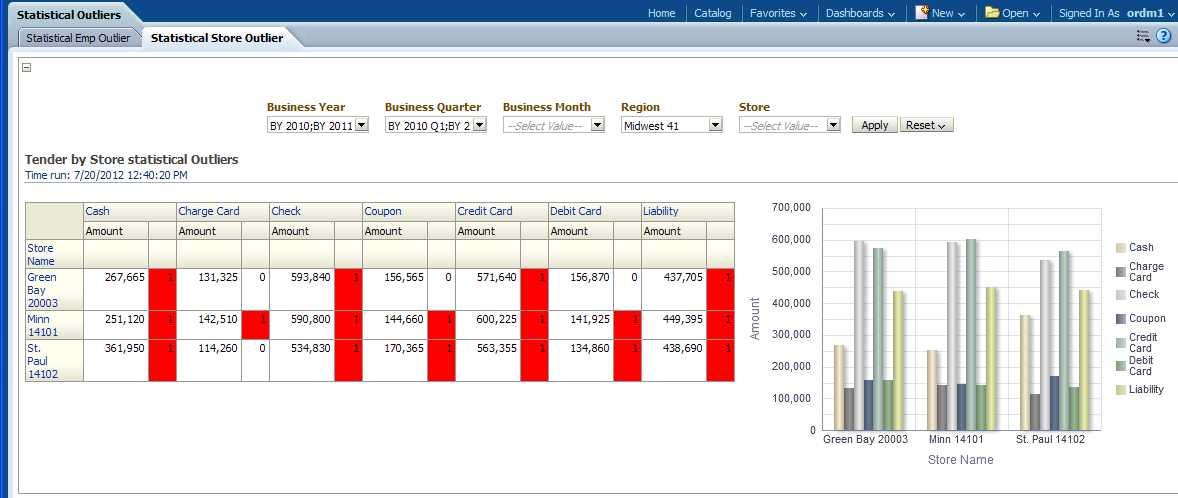
This report, as shown in Figure 13-26 provides the "Statistical Outlier" information for each organization store and tender.
Report dimensions are:
Organization
Tender
Figure 13-26 Statistical Store Outlier Report
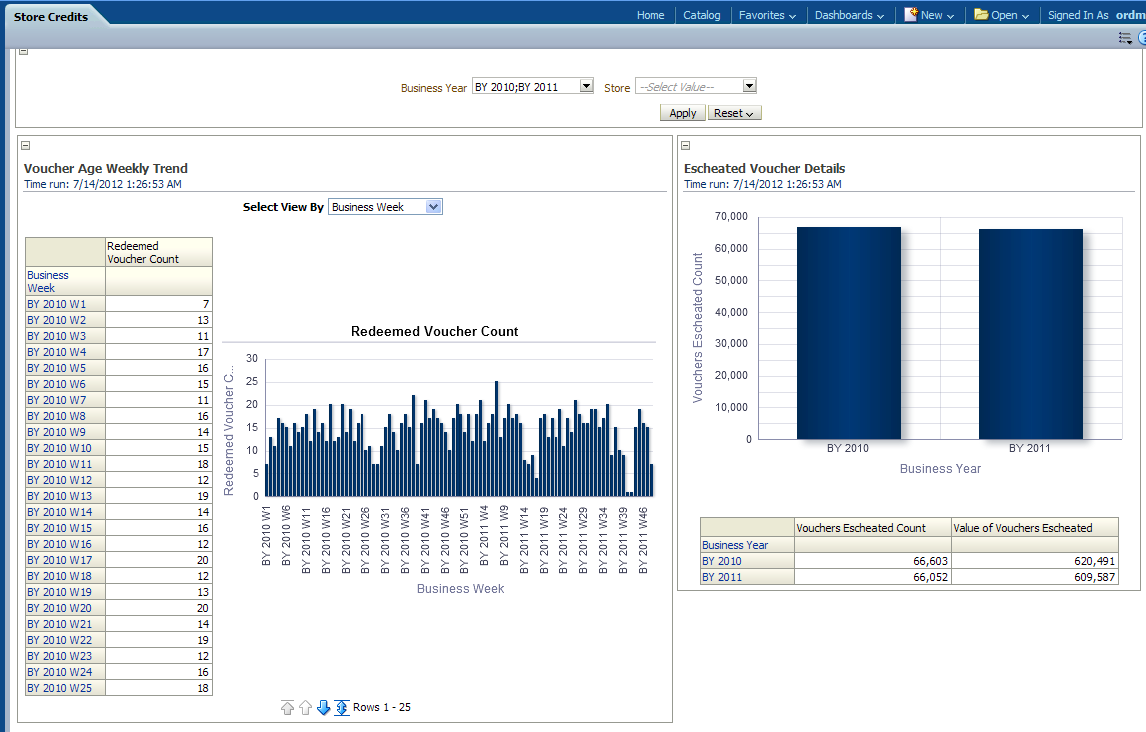
Store Credits area includes the following report: Store Credits.
This report, as shown in Figure 13-27 provides the yearly, monthly, quarterly and weekly "Store Credit" information.
The Inventory reports include the following areas:
Accounting area includes the following reports: Stock Ledger Gross Margin, Adjustment Summary, Inventory Adjustment, and Availability Analysis.
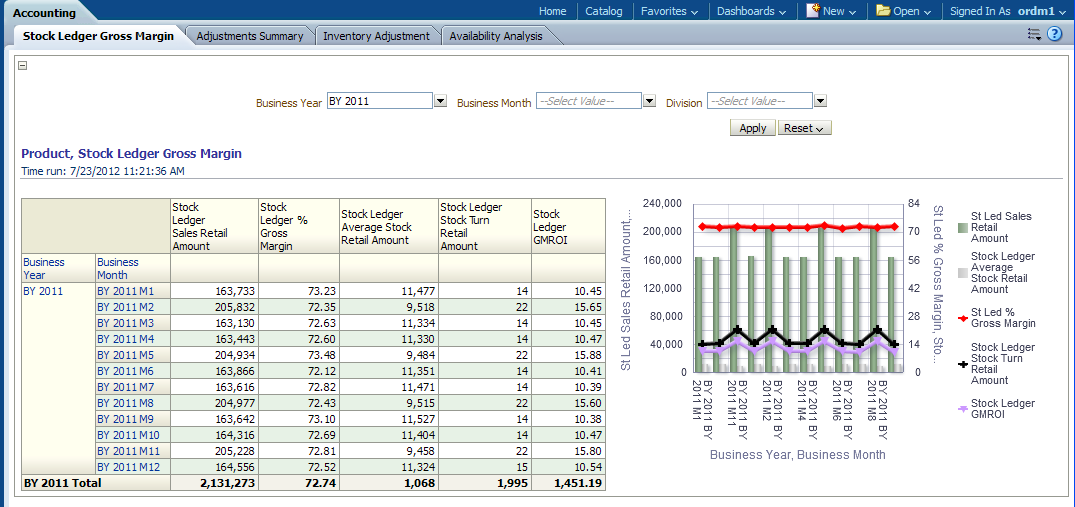
This report, as shown in Figure 13-28 provides the product and stock ledger gross margin report.
Report dimensions are:
Business Time
Organization
Figure 13-28 Stock Ledger Gross Margin Report
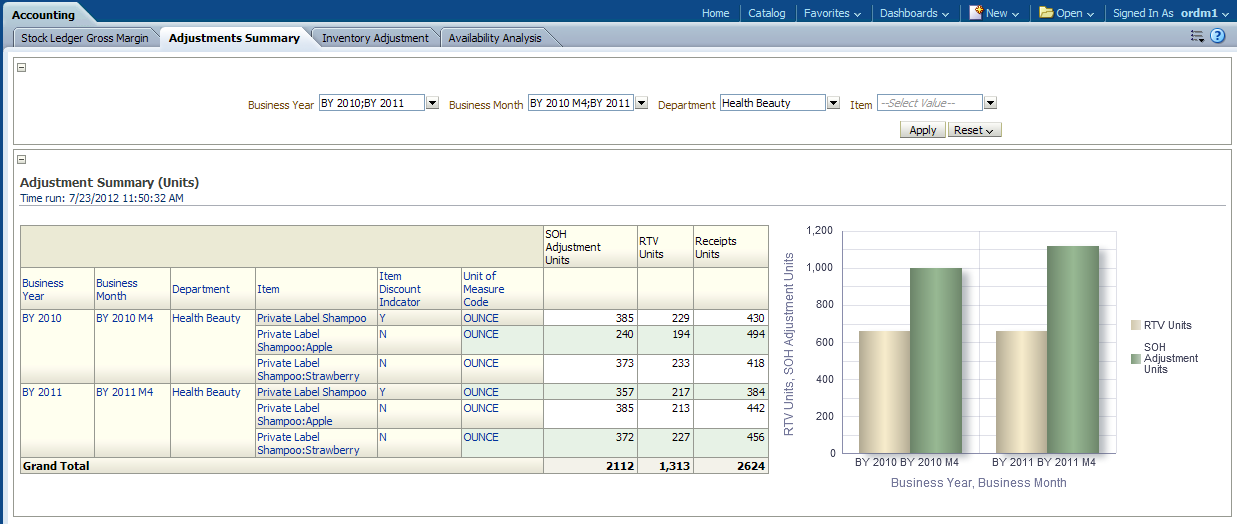
This report, as shown in Figure 13-29 provides yearly, monthly "Adjustment Summary" information for each item department and item.
Report dimensions are:
Business Time
Product
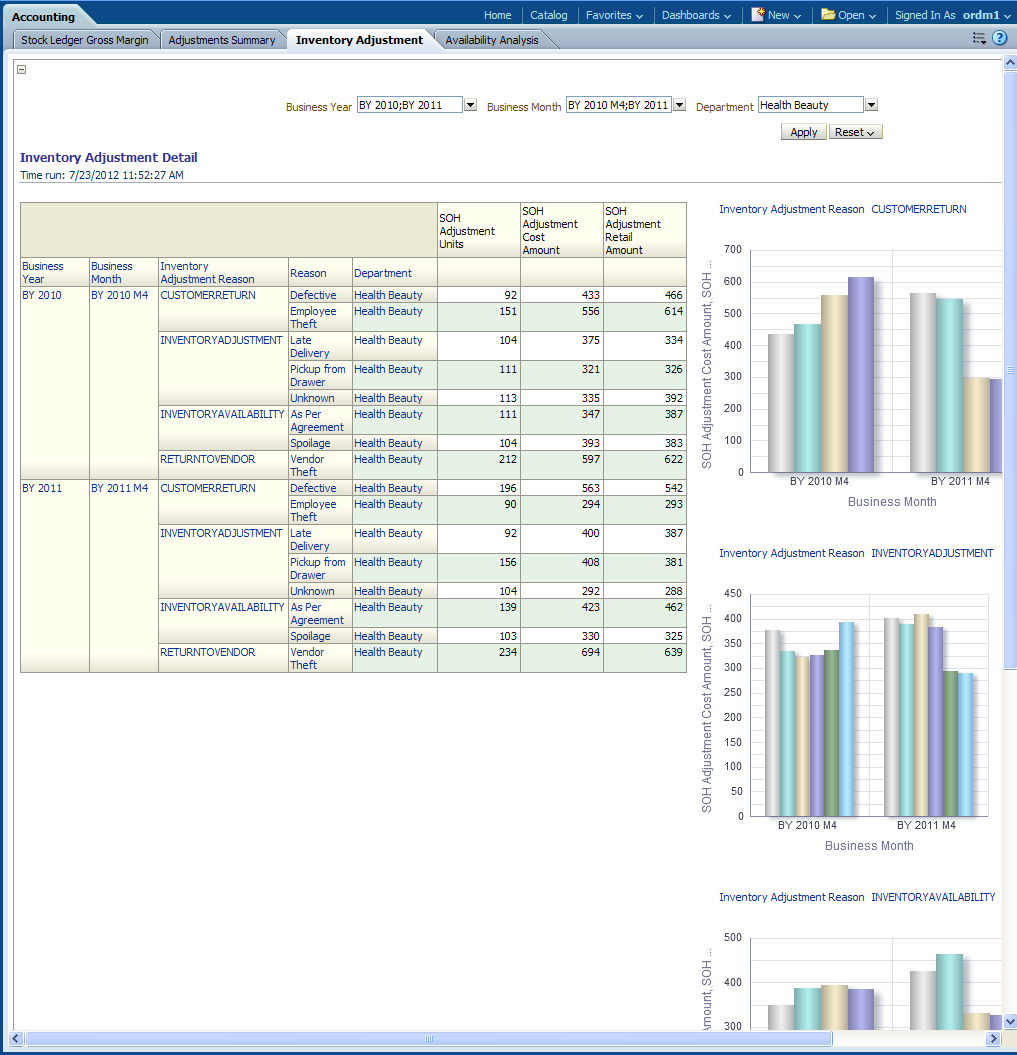
This report, as shown in Figure 13-30 provides yearly, monthly "Inventory Adjustment Details" for each department with reasons.
Report dimensions are:
Business Time
Product
Reason
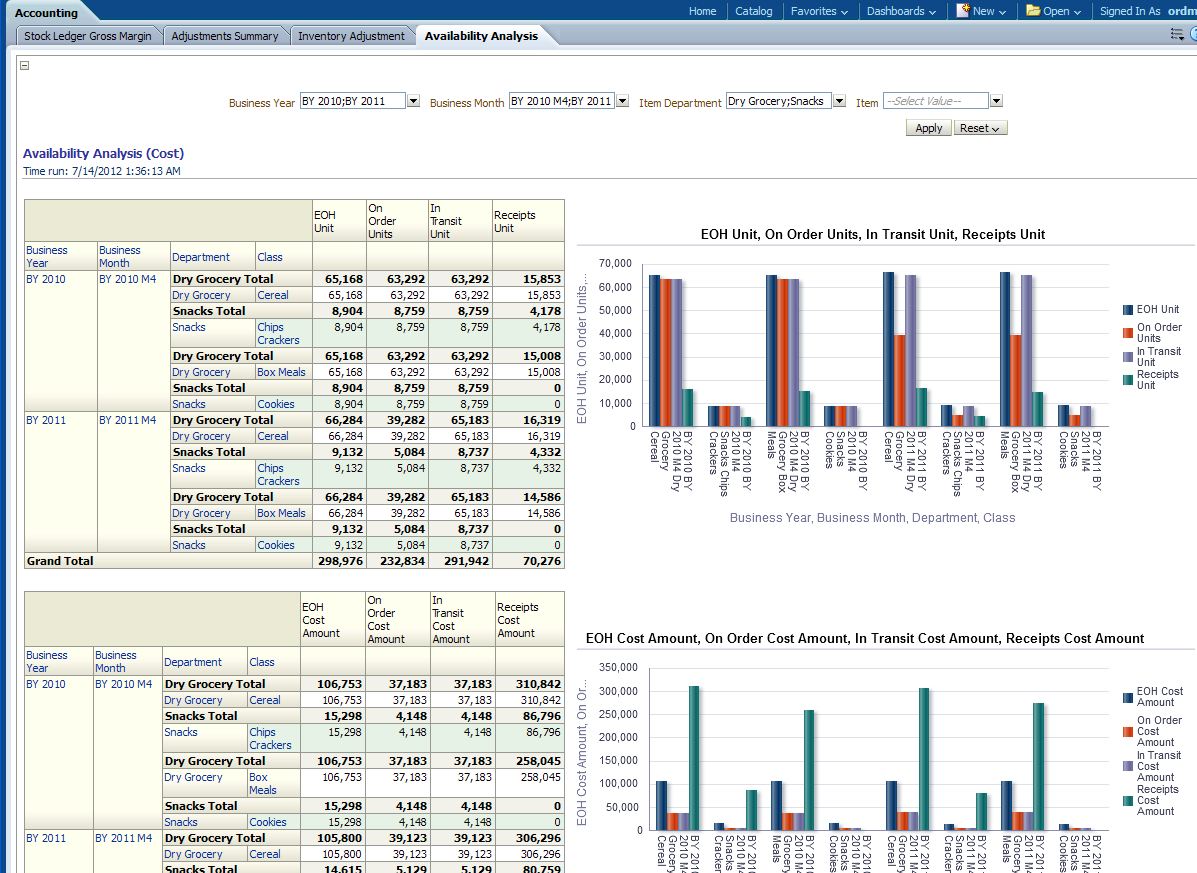
This report, as shown in Figure 13-31 analyses the yearly, monthly "Availability" information for each item department.
Report Dimensions are:
Business Time
Product
Figure 13-31 Availability Analysis Report
Compliance area includes the following reports: Vendor Compliance and Vendor Performance.
Merchandise area includes the following reports: .
Quality Assurance area includes the following reports:.
Stock Movement area includes the following reports: Inventory & Receipts, and Ending On Hand (EOH) Value.
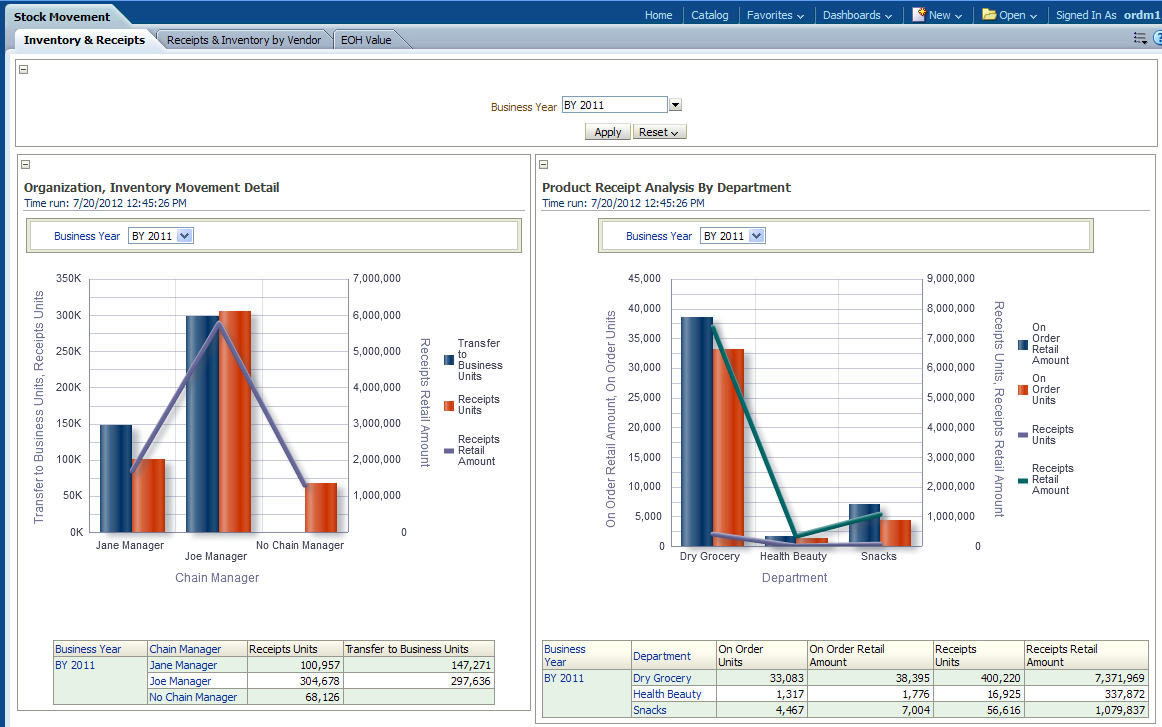
This report, as shown in Figure 13-32 provides the yearly "Inventory & Receipts" information for each department. Also provides the organization, Inventory movement details.
Report Dimensions are:
Business Time
Product
Organization
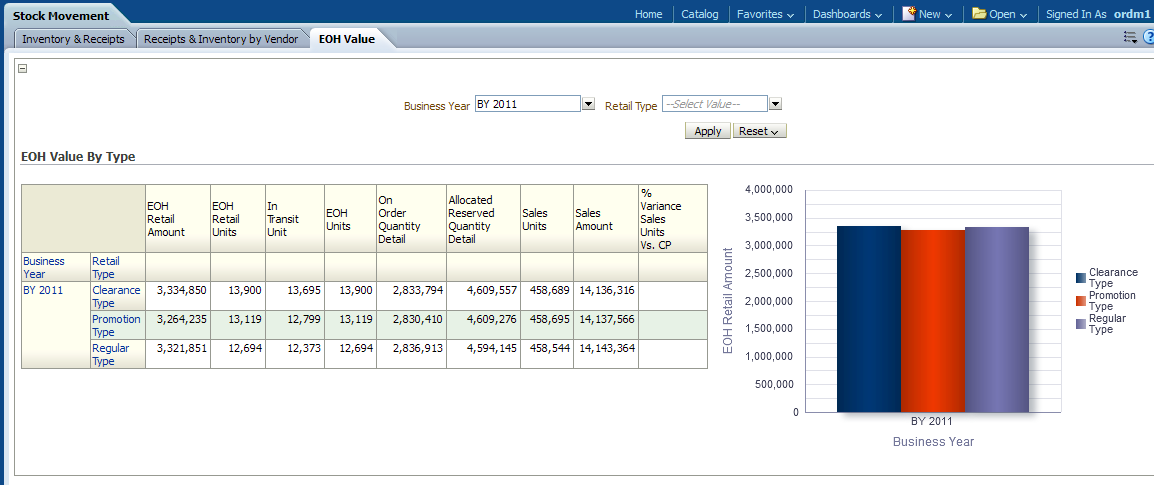
This report, as shown in Figure 13-33 provides the details about the stock at the end of a business year for each retail type.
Report Dimensions are:
Business Time
Retail Type
Figure 13-33 Ending On Hand (EOH) Value Report
Order Management Reports include the following areas:
The Store Operation reports include the following areas:
Stock Movement area includes the following reports: Sales Analysis, and Sales Comparison.
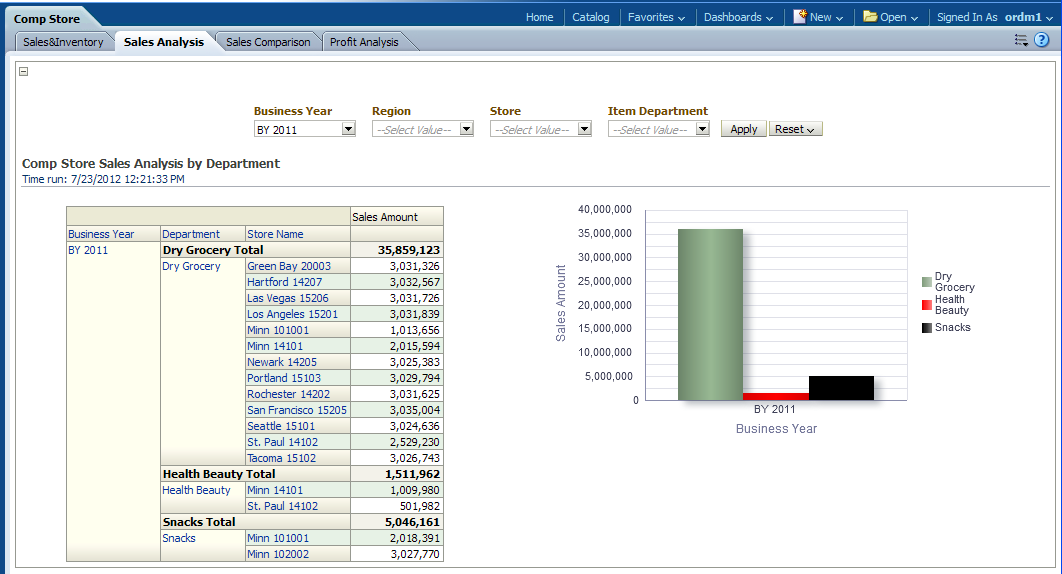
This report, as shown in Figure 13-34 provides the year level "Sales Analysis" information for each Region, Store and Item Department.
Report dimensions are:
Business Time
Organization
Product
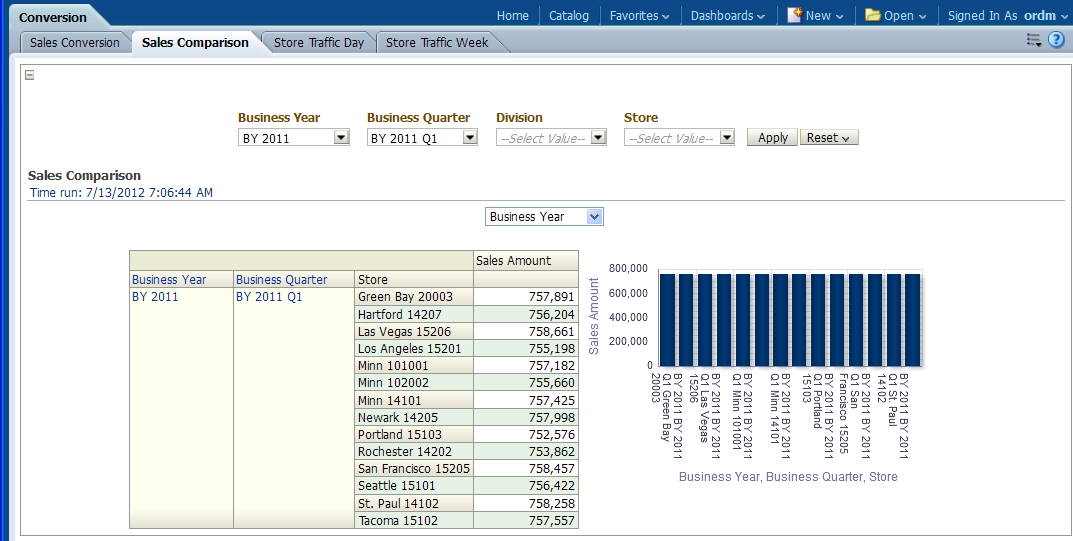
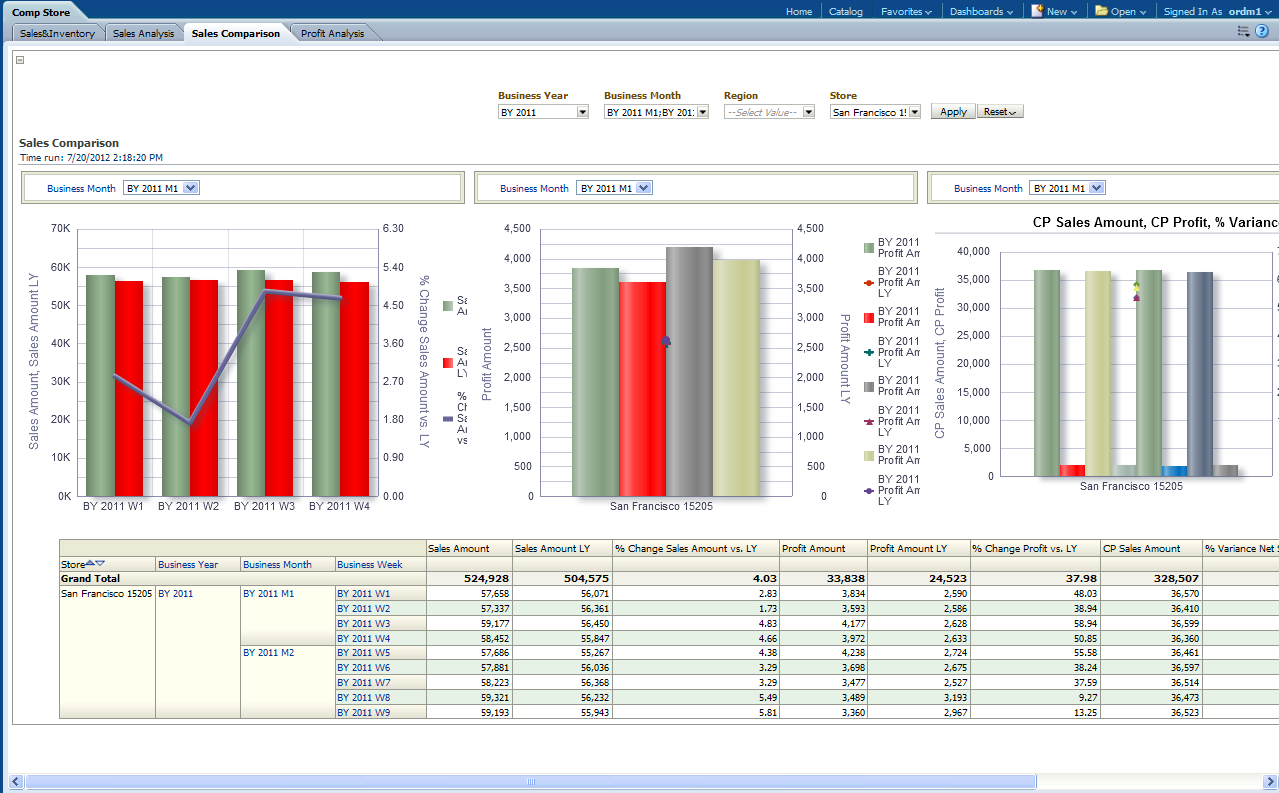
This report, as shown in Figure 13-35 provides the year month-level "Sales Comparison" information for each Region and each "Store" which can be compared with last year's metrics like LY, % Change LY.
Report dimensions are:
Business Time
Organization
Store Performance area includes the following reports: Contribution, Store Performance, Ranking, and Scorecard.
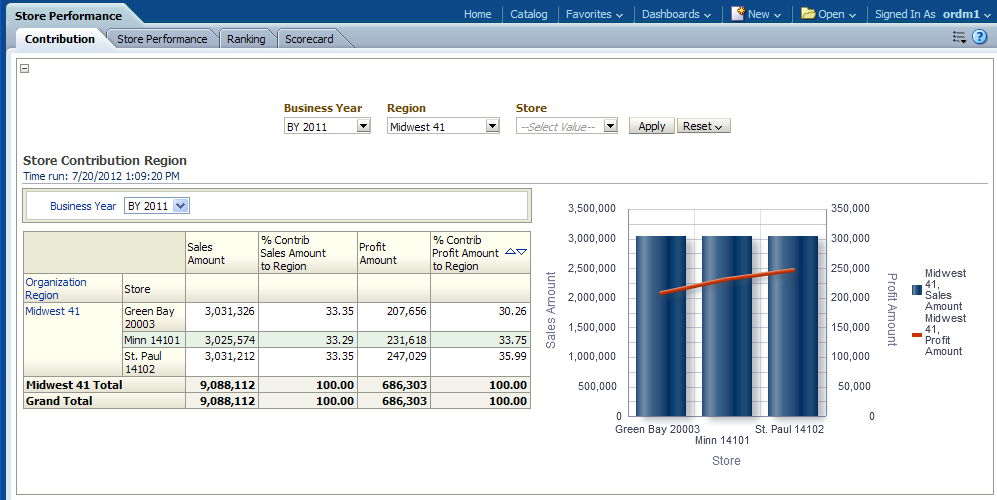
This report, as shown in Figure 13-36 provides the year level "Contribution" information for each Region and Store
Report dimensions are:
Business Time
Organization
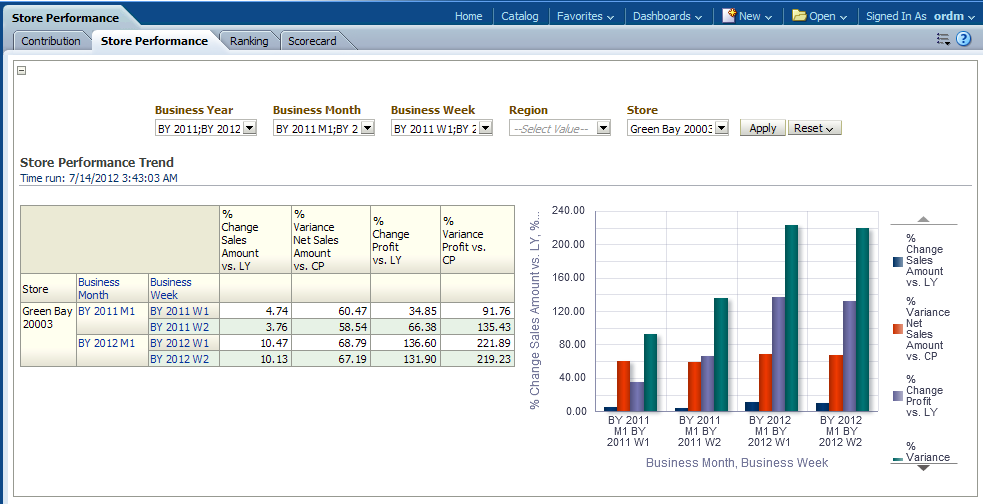
This report, as shown in Figure 13-37 provides the year month week-level "Store Performance Trend" information for each "Store" with respect to each "Organization Region" which can be compared with last year's metrics like LY, % Change LY.
Report dimensions are:
Business Time
Organization
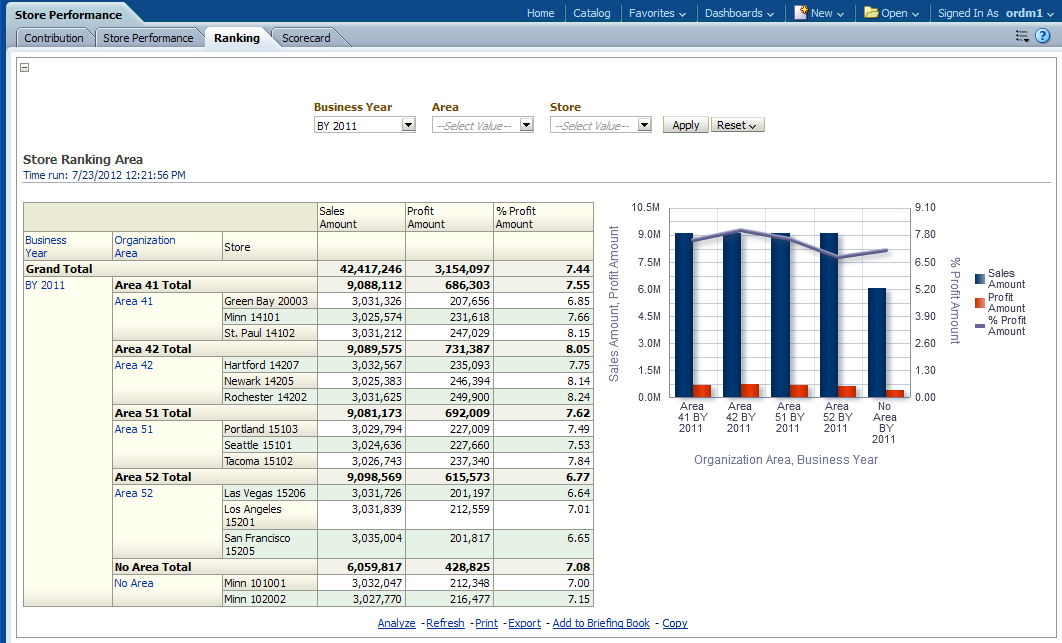
This report, as shown in Figure 13-38 provides the year level "Ranking" information for each Area and "Store".
Report dimensions are:
Business Time
Organization
Figure 13-38 Store Performance Ranking Report
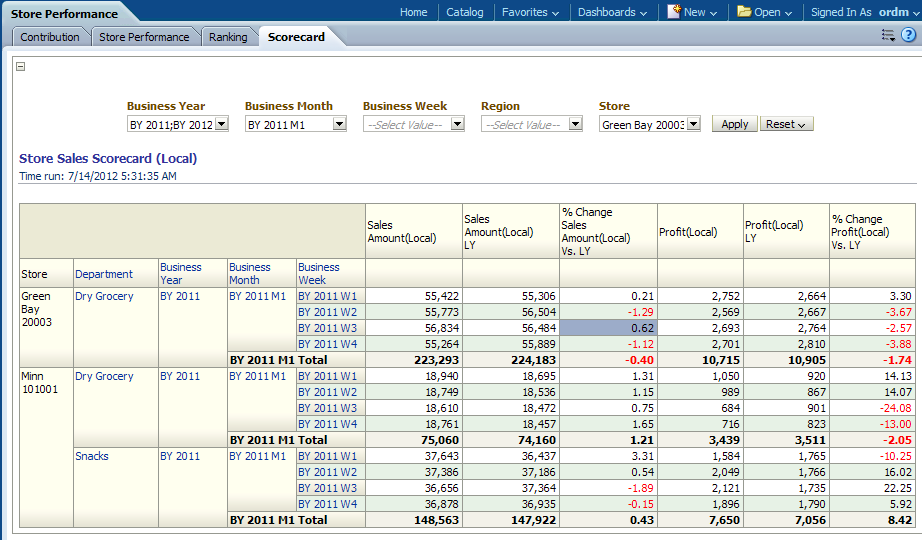
This report, as shown in Figure 13-39 provides the store sales scorecard,(Local) information for each Area and "Store".
Report dimensions are:
Business Time
Organization
Figure 13-39 Store Performance Scorecard Report
Over/Short area includes the following reports: Employee Over/Short and Store Over/Short.
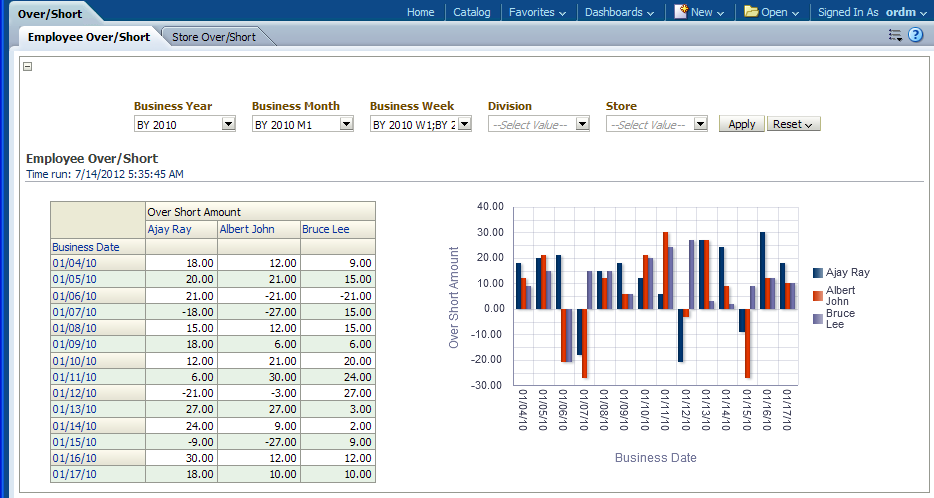
This report, as shown in Figure 13-39 provides the year month week-level "Employee Over/Short" information for each Employee with respect to each "Organization Division" and "Store".
Report dimensions are:
Business Time
Organization
Employee
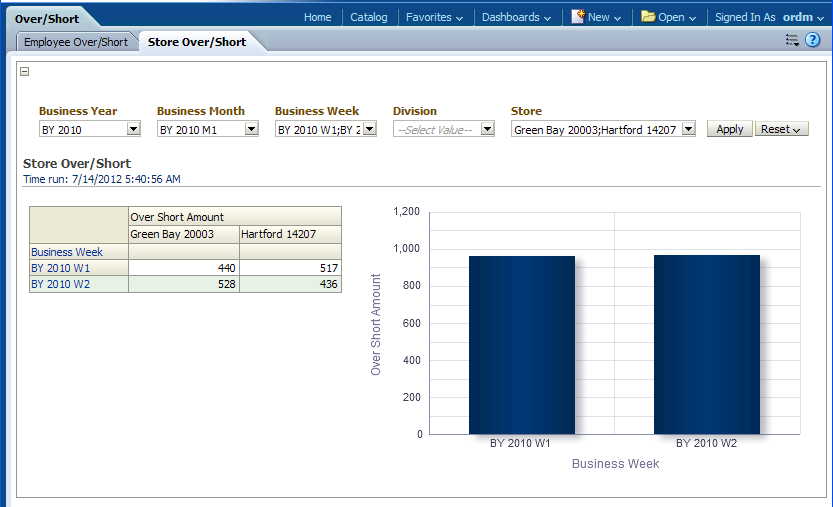
This report, as shown in Figure 13-41 provides the year month week-level "Store Over/Short" information for each "Store" with respect to each "Organization Division".
Report dimensions are:
Business Time
Organization
Traffic area includes the following reports: Store Traffic Day and Store Traffic Week.
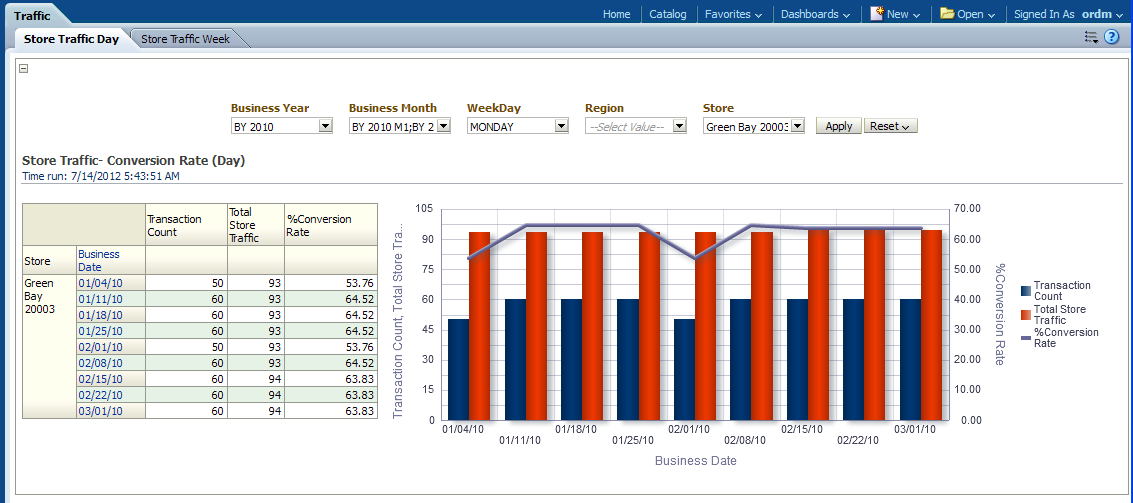
This report, as shown in Figure 13-42 provides the year month weekday-level "Store Traffic-Conversion Rate" information for each "Store" with respect to each "Organization Region".
Report dimensions are:
Business Time
Organization
Figure 13-42 Traffic Store Traffic Day Report
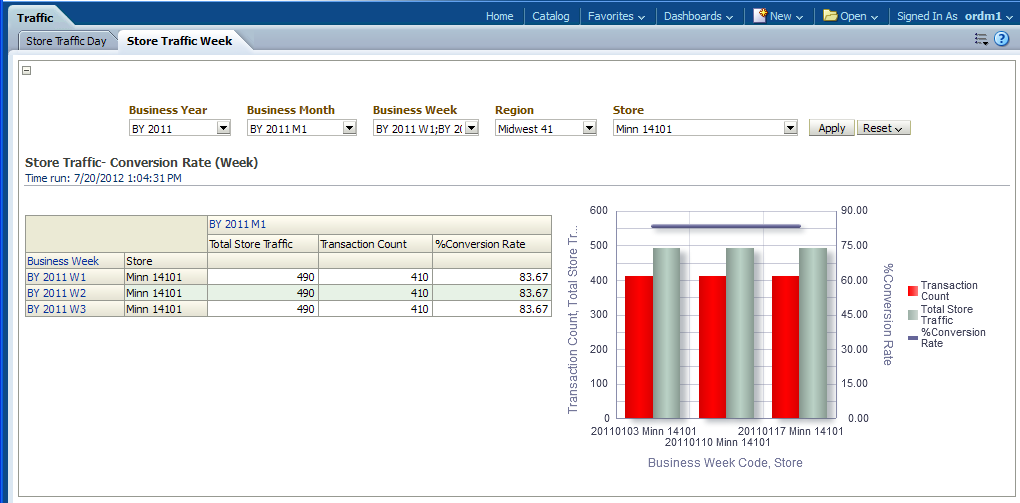
This report, as shown in provides the year month week-level "Store Traffic-Conversion Rate" information for each "Store" with respect to each "Organization Region".
Report dimensions are:
Business Time
Organization
Transaction includes the Transaction report.
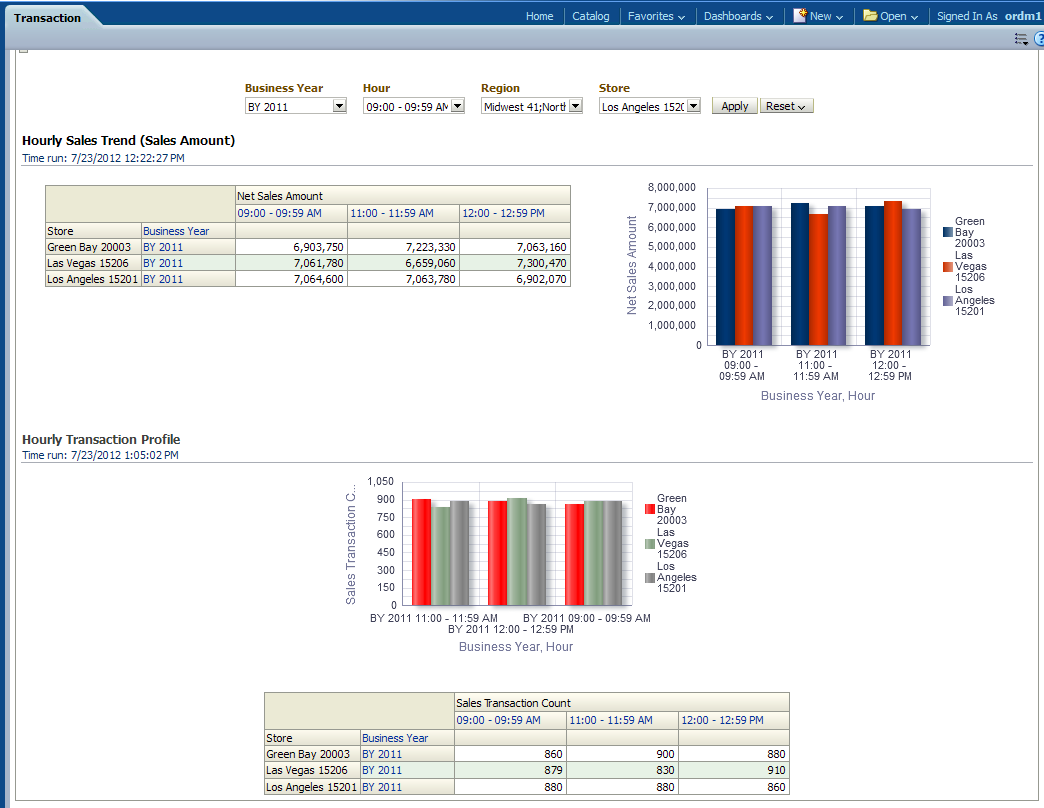
This report, as shown in Figure 13-44 provides.
Report dimensions are:
Business Time
Organization
Time of Day
Figure 13-44 Store Operation Transaction Report
|
Copyright © 2009, 2012, Oracle and/or its affiliates. All rights reserved. Legal Notices |
|