| Oracle® Retail Data Model Reference Release 11.3.1 Part Number E20361-01 |
|
|
PDF · Mobi · ePub |
| Oracle® Retail Data Model Reference Release 11.3.1 Part Number E20361-01 |
|
|
PDF · Mobi · ePub |
This chapter provides reference information about the data mining models in Oracle Retail Data Model.
This chapter includes the following sections:
Note:
For instructions on setting up and loading the data mining source, and executing the data mining models, see Oracle Retail Data Model Implementation and Operations Guide.Oracle Retail Data Model includes data mining packages. The data mining portion of Oracle Retail Data Model consists of source tables that are populated by detail data for use by the data mining packages. This data is organized to be compatible with the data mining modules so they can properly analyze and mine the data. Data mining packages pull in the source data and feed it into the data mining packages, and populate the target tables with the results. The data in the target tables can be presented in Oracle Business Intelligence Suite Enterprise Edition reports.
Tip:
Changed or new data models are not supported by Oracle Retail Data Model. Consequently, do not change the data models that are defined and delivered with Oracle Retail Data Model, but, instead, copy a delivered data model to create a new one.Oracle Retail Data Model creates mining models using the following Oracle Data Mining algorithms:
Support Vector Machine (SVM) - Classification
Decision Tree (DT) - Classification
K-Means for Clustering
Other technology: Automatic Data Preparation (ADP)
For more information about these algorithms, see Oracle Data Mining Concepts.
Each package (analysis) builds models using one or two of these algorithms. The models built depend on the analysis being performed. The output of the model build is a view containing rules generated by the model.
As shown in Table 10-1, the Oracle Retail Data Model mining models use the specified algorithms for the specific problem.
Table 10-1 Oracle Retail Data Model Mining Algorithm Types Used by Model
| Model | Algorithms Used by Data Mining Model |
|---|---|
|
Classification and Regression: Support Vector Machine (SVM) and Decision Tree (DT) |
|
|
Classification and Regression: SVM and DT |
|
|
Classification: SVM and DT |
|
|
Classification and Regression: SVM and DT |
|
|
Classification and Regression: SVM and DT |
|
|
Association Rules: Apriori |
|
|
Regression: SVM |
|
|
Classification: SVM and DT |
|
|
Clustering: K-Means |
|
|
Regression: SVM |
|
|
Classification: SVM and DT |
|
|
Classification: SVM |
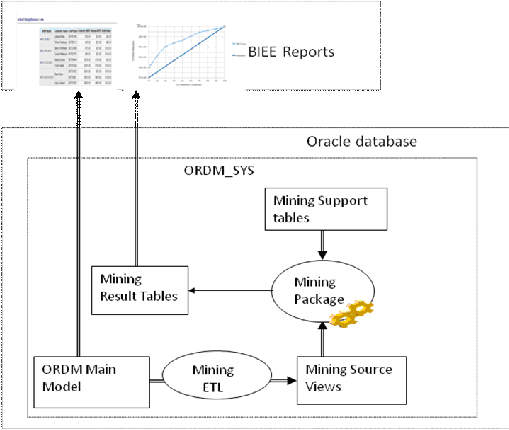
For each data mining model, there is:
A Mining model procedure in the mining package: Given source data, to generate mined rules, predict results, and so on.
Mining model source MVs (Materialized Views in the schema ordm_sys)
Mining model Target tables (tables in schema ordm_sys)
Mining model Support tables (Algorithm settings tables)
Figure X shows the mining model components:
Use the following steps to build the mining models:
Create mining source and apply MVs over ordm_sys base, reference, derived and lookup tables. Each source MV will have data till last month. Mining MVs will have data for current month.
Create the mining package.
Call pkg_ordm_mining.refresh_mining_source procedure to refresh all mining source and apply MVs.
Call pkg_ordm_mining.refresh_model to build all the mining models.
Over time, the customer information and the customer behavior may change. Therefore, you may want to refresh the trained mining models based on the latest customer and usage data. The mining model refresh process is generally divided into three tasks:
Data Preparation: Load and transform the data into a format that the mining algorithms can understand. Also a customer must prepare two sets of data corresponding to next two tasks:
Training Data
Scoring data
Training: Based on part of customer data, user can run certain algorithms and then a mining model is generated.
Scoring (applying): The trained model can be applied onto other customer data. This applies the model to do the prediction or other missions the model is designed to perform.
For more information about the Oracle Mining training and Scoring (applying) process, see Oracle Data Mining Concepts.
To refresh all six mining models based on latest customer data, call the procedure named pkg_ordm_mining.refresh_model. This procedure performs the following tasks for each model:
Refreshes the mining source materialized views based on latest data from ordm_sys.
Trains each mode again using the new training data.
Applies each model onto the new apply data set.
The errors that occur during mining model refresh are saved into the table named: DWC_INTRA_ETL_ACTIVITY as is other standard Oracle Retail Data Model Intra-ETL package errors and information.
Table 10-2 lists the Oracle Retail Data Model data mining target tables.
Table 10-2 Oracle Retail Data Model Data Mining Target Tables
| Table Name | Associated Data Mining Model |
|---|---|
|
DWD_CLASS_PRC_ELSTY_SVM_FACTOR |
|
|
DWD_CUST_CHRN_DT_RULES |
|
|
DWD_CUST_CHRN_SVM_FACTOR |
|
|
DWD_CUST_LTV_DT_RULES |
|
|
DWD_CUST_LTV_SVM_FACTOR |
|
|
DWD_CUST_LYLTY_RULES |
|
|
DWD_CUST_LYLTY_SVM_FACTOR |
|
|
DWD_CUST_MNNG |
|
|
DWD_EMP_BSKT_RULES |
|
|
DWD_EMP_BSKT_SVM_FACTOR |
|
|
DWD_EMP_CMBNTN_DT_RULES |
|
|
DWD_EMP_CMBNTN_MNNG |
|
|
DWD_EMP_SLS_RULES |
|
|
DWD_EMP_SLS_SVM_FACTOR |
|
|
DWD_ITEM_POS_LOSS_RULES |
|
|
DWD_ITEM_POS_LOSS_SVM_FACTOR |
|
|
DWD_PROD_DEPTMIX_ASSOC_RULES |
|
|
DWD_SKU_PRC_ELSTY_SVM_FACTOR |
|
|
DWD_STORE_LOSS_RULES |
|
|
DWD_STORE_LOSS_SVM_FACTOR |
|
|
DWR_CUST_SGMNT |
|
|
DWR_CUST_SGMNT_DTL |
Each description of the Oracle Retail Data Model data mining models provides the following information:
A description of the model
Examples of desired rules
A discussion of what the discovered rules explain
A discussion of what the model mines
A list of the target variables
The names of the target tables
The business problem is to build a profile of employees to explain their basket KPIs, such as Total baskets, Average Basket Value, and other statistics and predict KPIs of employees.
The KPIs are converted into categorical variables using standard database binning operations for Decision Tree algorithm. The categorical variables are modeled as a classification model to identify or predict the impact of various independent variables (attributes) on the dependent target variable (KPI - categorical). Using Oracle Data Mining, the binned KPIs are modeled using classification algorithm Decision Tree (DT) and the actual KPIs are modeled using classification algorithm Support Vector Machines (SVM).
This analysis identifies which key attributes of an employee influence his or her number of baskets sold, average basket value, and basket size. This model mines the various attributes of employees. The model takes the binned variables one at a time for the Total Basket Count, Average Basket Value, and Average Basket Size as the target variable of a Decision Tree (DT) with a single feature and discovers rules described in terms of employee attributes. The SVM model takes one of three KPIs (Total Basket Count, Average Basket Value, and Average Basket Size) at a time as a target variable.
The output from the model is two fold:
The discovered rules provide correlation between the basket KPIs and employee attributes.
The prediction can be made on new employees data using the model built on past data.
The rules are designed to be generated monthly. Therefore, three SVM and nine DT models are created every month across all the employees using the following variables as targets:
Target variables for Decision Tree (DT) are:
Total Basket Count Quartile (TBCQR)
Total Basket Count Quintile (TBCQN)
Total Basket Count Decile (TBCDE)
Average Basket Value Quartile (ABVQR)
Average Basket Value Quintile (ABVQN)
Average Basket Value Decile (ABVDE)
Average Basket Size Quartile (ABSQR)
Average Basket Size Quintile (ABSQN)
Average Basket Size Decile (ABSDE)
Note: Employees are grouped into N-Tiles according to their sales performance figures.
Target variables for Support Vector Machines (SVM) are:
Total Basket Count (TBC)
Average Basket Value (ABV)
Average Basket Size (ABS)
The attributes shown in Table 10-3 for employees are identified from the Oracle Retail Data Model data warehouse tables as source variables for the models (a few of these variables are unique identifiers and are treated as supplementary variables).
Table 10-3 Employee Basket Analysis Source Attributes
| Attribute Name |
|---|
|
Case Id Alt (PK) |
|
Month Code |
|
Employee Id |
|
Designation Name |
|
Designation Title |
|
Designation Level |
|
Nationality |
|
Gender |
|
Marital Status |
|
Age |
|
Net Income |
|
Demographics Code |
|
Title |
|
Total Months of Job |
|
Employee Type |
|
Correspondence Language |
|
Disability Indicator |
|
Rehire Recommendation Indicator |
|
HR Based Salary Eligibility Indicator |
|
Overtime Hours Salary Eligibility Indicator |
|
Commission Eligibility Indicator |
|
Spiff Allowed Flag |
|
Total Hours Worked |
|
Total Overtime Hours |
The DT rules are stored in target table, dwd_emp_bskt_rules.
The SVM factor details of source attributes are stored in target table, dwd_emp_bskt_svm_factor.
Desired Rules Examples:
IF SALARY ELIGIBILITY IS (N) AND EMPLOYEE_TYPE IS (TEMPORARY)
THEN
NUMBER OF BASKETS IS THE HIGHEST
IF SALARY ELIGIBLITY IS (N) AND EMPLOYEE_TYPE IS (TEMPORARY)
THEN
NUMBER OF BASKETS IS THE LOWEST
Table 10-4 shows sample Employee Basket Analysis Attribute Ranking with SVM Factors.
Table 10-4 Employee Basket Analysis Attribute Ranking with SVM Factors
| Attribute Name | Attribute Value | Coefficient | Rank |
|---|---|---|---|
|
DESIGNATION_NAME |
TEMPORARY CASHIER |
0.89 |
1 |
|
COMMISSION_ELIGIBILITY_IND |
N |
0.45 |
2 |
|
HR_BASED_SALARY_ELGBLTY_IND |
Y |
0.37 |
3 |
|
SPIFF_ALLOWED_FLAG |
N |
0.21 |
4 |
|
DESIGNATION_NAME |
JUNIOR SUPERVISOR |
0.19 |
5 |
Table 10-5 shows sample Employee Basket Analysis Employee KPIs Prediction using DT.
Table 10-5 Employee Basket Analysis Employee KPIs Prediction using DT Sample 1
| Employee ID | Employee Name | Target Variable | DT Prediction | DT Probability |
|---|---|---|---|---|
|
10001 |
Chloe Waite |
AVG_BASKET_SIZE_DECILE |
7 |
0.65 |
|
10002 |
Delora Walker |
AVG_BASKET_SIZE_DECILE |
4 |
0.87 |
|
10003 |
Max Gerber |
AVG_BASKET_SIZE_DECILE |
8 |
0.94 |
|
10004 |
Glen Christian |
AVG_BASKET_SIZE_DECILE |
3 |
0.82 |
|
10005 |
Mason Murray |
AVG_BASKET_SIZE_DECILE |
10 |
0.96 |
Table 10-6 shows sample Employee Basket Analysis Employee KPIs Prediction using DT.
Table 10-6 Employee Basket Analysis Employee KPIs Prediction using DT Sample 2
| Employee ID | Employee Name | Target Variable | DT Prediction | DT Probability |
|---|---|---|---|---|
|
10001 |
Chloe Waite |
TOTAL_BASKET_COUNT_QUINTILE |
5 |
0.65 |
|
10002 |
Delora Walker |
TOTAL_BASKET_COUNT_QUINTILE |
3 |
0.87 |
|
10003 |
Max Gerber |
TOTAL_BASKET_COUNT_QUINTILE |
1 |
0.94 |
|
10004 |
Glen Christian |
TOTAL_BASKET_COUNT_QUINTILE |
3 |
0.82 |
|
10005 |
Mason Murray |
TOTAL_BASKET_COUNT_QUINTILE |
4 |
0.96 |
Table 10-7 shows sample Employee Basket Analysis Employee KPIs Prediction using SVM.
Table 10-7 Employee Basket Analysis Employee KPIs Prediction using SVM Sample 1
| Employee ID | Employee Name | Target Variable | SVM Prediction |
|---|---|---|---|
|
10001 |
Chloe Waite |
AVG_BASKET_SIZE |
35 |
|
10002 |
Delora Walker |
AVG_BASKET_SIZE |
45 |
|
10003 |
Max Gerber |
AVG_BASKET_SIZE |
60 |
|
10004 |
Glen Christian |
AVG_BASKET_SIZE |
30 |
|
10005 |
Mason Murray |
AVG_BASKET_SIZE |
50 |
Table 10-8 shows sample Employee Basket Analysis Employee KPIs Prediction using SVM.
Table 10-8 Employee Basket Analysis Employee KPIs Prediction using SVM Sample 2
| Employee ID | Employee Name | Target Variable | SVM Prediction |
|---|---|---|---|
|
10001 |
Chloe Waite |
TOTAL_BASKET_COUNT |
125 |
|
10002 |
Delora Walker |
TOTAL_BASKET_COUNT |
110 |
|
10003 |
Max Gerber |
TOTAL_BASKET_COUNT |
95 |
|
10004 |
Glen Christian |
TOTAL_BASKET_COUNT |
115 |
|
10005 |
Mason Murray |
TOTAL_BASKET_COUNT |
100 |
The business problem is to build a profile of employees to explain their sales, cost, and profit KPIs, such as Sales Amount, Cost Amount, Profit Amount, and other statistics and predict employee KPIs.
The KPIs are converted into categorical variables using standard database binning operations for Decision Tree algorithm. The categorical variables are modeled as a classification model to identify or predict the impact of various independent variables (attributes) on the dependent target variable (KPI - categorical). Using Oracle Data Mining, the binned KPIs are modeled using classification Algorithm Decision Tree (DT) and the actual KPIs are modeled using classification algorithm Support Vector Machines (SVM).
This analysis identifies which key attributes of an employee influence sales amount, cost amount, and profit amount. This model mines the various attributes of employees. The model takes the binned variables one at a time for the Sales Amount, Cost Amount, and Profit Amount as the target variable of a Decision Tree (DT) model with a single feature and discovers rules described in terms of employee attributes. The SVM model takes one of three KPIs (Sales Amount, Cost Amount, and Profit Amount) at a time as a target variable.
The output from the model is twofold:
The discovered rules provide correlation between the Sales, Cost, and Profit KPIs and employee attributes.
A prediction can be made on new employees' data using the model built on past data.
The rules are designed to be generated monthly. Therefore, three SVM and nine DT models are created every month across all the employees using the following variables as targets:
Target variables for Decision Tree (DT) are:
Sales Amount Quartile (SAQR)
Sales Amount Quintile (SAQN)
Sales Amount Decile (SADE)
Cost Amount Quartile (CAQR)
Cost Amount Quintile (CAQN)
Cost Amount Decile (CADE)
Profit Amount Quartile (PAQR)
Profit Amount Quintile (PAQN)
Profit Amount Decile (PADE)
Target variables for Support Vector Machines (SVM) are:
Sales Amount (SA)
Cost Amount (CA)
Profit Amount (PA)
Table 10-9 shows the attributes for employees that are identified from the Oracle Retail Data Model data warehouse tables as source variables for the models (a few of these variables are unique identifiers and are treated as supplementary variables).
Table 10-9 Employee Sales Analysis Source Table
| Attribute Name |
|---|
|
Case Id Alt (PK) |
|
Month Code |
|
Employee Id |
|
Designation Name |
|
Designation Title |
|
Designation Level |
|
Nationality |
|
Gender |
|
Marital Status |
|
Age |
|
Net Income |
|
Demographics Code |
|
Title |
|
Total Months of Job |
|
Employee Type |
|
Correspondence Language |
|
Disability Indicator |
|
Rehire Recommendation Indicator |
|
HR Based Salary Eligibility Indicator |
|
Overtime Hours Salary Eligibility Indicator |
|
Commission Eligibility Indicator |
|
Spiff Allowed Flag |
|
Total Hours Worked |
|
Total Overtime Hours |
The DT rules are stored in target table, dwd_emp_sls_rules.
The SVM factor details of source attributes are stored in target table, dwd_emp_sls_svm_factor.
Desired Rules Examples:
IF EMPLOYEE IS NOT ELIGIBLE FOR SPIFF AND EMPLOYEE IS ELIGIBLE FOR SALARY
AND EMPLOYEE IS NOT ELIGIBLE FOR COMMISSION
THEN
EMPLOYEE PROFIT IS THE LOWEST
IF EMPLOYEE IS ELIGIBLE FOR SPIFF AND EMPLOYEE IS NOT ELIGIBLE FOR SALARY
AND EMPLOYEE IS NOT ELIGIBLE FOR COMMISSION
THEN
EMPLOYEE PROFIT IS THE HIGHEST
Table 10-10 shows sample Employee Sales Analysis Attribute Ranking with SVM Factors.
Table 10-10 Employee Sales Analysis Attribute Ranking with SVM Factors
| Attribute Name | Attribute Value | Coefficient | Rank |
|---|---|---|---|
|
DESIGNATION_NAME |
TEMPORARY CASHIER |
0.89 |
1 |
|
COMMISSION_ELIGIBILITY_IND |
N |
0.45 |
2 |
|
HR_BASED_SALARY_ELGBLTY_IND |
Y |
0.37 |
3 |
|
SPIFF_ALLOWED_FLAG |
N |
0.21 |
4 |
|
DESIGNATION_NAME |
JUNIOR SUPERVISOR |
0.19 |
5 |
Table 10-11 shows sample Employee Sales Analysis Employee KPIs Prediction using DT.
Table 10-11 Employee Sales Analysis Employee KPIs Prediction using DT Sample 1
| Employee ID | Employee Name | Target Variable | DT Prediction | DT Probability |
|---|---|---|---|---|
|
10001 |
Chloe Waite |
SALES_AMOUNT_DECILE |
7 |
0.65 |
|
10002 |
Delora Walker |
SALES_AMOUNT_DECILE |
4 |
0.87 |
|
10003 |
Max Gerber |
SALES_AMOUNT_DECILE |
8 |
0.94 |
|
10004 |
Glen Christian |
SALES_AMOUNT_DECILE |
3 |
0.82 |
|
10005 |
Mason Murray |
SALES_AMOUNT_DECILE |
10 |
0.96 |
Table 10-12 shows sample Employee Sales Analysis Employee KPIs Prediction using DT.
Table 10-12 Employee Sales Analysis Employee KPIs Prediction using DT Sample 2
| Employee ID | Employee Name | Target Variable | DT Prediction | DT Probability |
|---|---|---|---|---|
|
10001 |
Chloe Waite |
COST_AMOUNT_QUINTILE |
5 |
0.65 |
|
10002 |
Delora Walker |
COST_AMOUNT_QUINTILE |
3 |
0.87 |
|
10003 |
Max Gerber |
COST_AMOUNT_QUINTILE |
1 |
0.94 |
|
10004 |
Glen Christian |
COST_AMOUNT_QUINTILE |
3 |
0.82 |
|
10005 |
Mason Murray |
COST_AMOUNT_QUINTILE |
4 |
0.96 |
Table 10-13 shows sample Employee Sales Analysis Employee KPIs Prediction using SVM.
Table 10-13 Employee Sales Analysis Employee KPIs Prediction using SVM Sample 1
| Employee ID | Employee Name | Target Variable | SVM Prediction |
|---|---|---|---|
|
10001 |
Chloe Waite |
SALES_AMOUNT |
3500 |
|
10002 |
Delora Walker |
SALES_AMOUNT |
4500 |
|
10003 |
Max Gerber |
SALES_AMOUNT |
6000 |
|
10004 |
Glen Christian |
SALES_AMOUNT |
3000 |
|
10005 |
Mason Murray |
SALES_AMOUNT |
5000 |
Table 10-14 shows sample Employee Sales Analysis Employee KPIs Prediction using SVM.
Table 10-14 Employee Sales Analysis Employee KPIs Prediction using SVM Sample 2
| Employee ID | Employee Name | Target Variable | SVM Prediction |
|---|---|---|---|
|
10001 |
Chloe Waite |
COST_AMOUNT |
1250 |
|
10002 |
Delora Walker |
COST_AMOUNT |
1100 |
|
10003 |
Max Gerber |
COST_AMOUNT |
950 |
|
10004 |
Glen Christian |
COST_AMOUNT |
1150 |
|
10005 |
Mason Murray |
COST_AMOUNT |
1000 |
The business problem is to build a profile of customers to explain impact of customers' characteristics on their loyalty to a store. Using Oracle Data Mining, the KPIs are modeled using two popular Classification Algorithms - Decision Tree (DT) and Support Vector Machines (SVM). This analysis identifies which key attributes of a customer influence his loyalty to a store. This model mines the various attributes of customers.
The output from the model is twofold:
The discovered rules provide correlation between the customer loyalty to a store and customer attributes.
A prediction can be made on new customers' data using the model built on historical data.
The rules are designed to be generated monthly. Therefore, one SVM and one DT models are created every month across all customers using the following variables as targets:
Target variable for Decision Tree (DT) is:
Customer Loyalty Code
Target variable for Support Vector Machines (SVM) is:
Customer Loyalty Code
Table 10-15 shows the attributes for customers that are identified from the Oracle Retail Data Model data warehouse tables as source variables for the models (a few of these variables are unique identifiers and are treated as supplementary variables).
Table 10-15 Customer Loyalty Analysis Source Table
| Attribute Name | Attribute Description |
|---|---|
|
Case Id Alt (PK) |
|
|
Month Code |
|
|
Customer Number |
|
|
Customer Type |
|
|
Frequent Shopper Indicator |
|
|
Mail Allowed Indicator |
|
|
Customer District |
|
|
Customer City |
|
|
Customer State |
|
|
Customer Country |
|
|
Primary Occasion |
|
|
Primary Preference |
|
|
Primary Status Code |
|
|
Primary Status Reason Code |
|
|
Primary Effective Date |
|
|
No. Of Survival months |
|
|
Primary Effective Date |
|
|
Living at Current Address Since |
|
|
INDIVIDUAL CUSTOMER ATTRIBUTES |
|
|
Registered as Gift Receiver |
|
|
Registered as Gift Giver |
|
|
Customer Identity Required Indicator |
|
|
Customer Identity Type Name |
|
|
Age |
|
|
Marital Status |
|
|
Gender |
|
|
Income |
|
|
Race |
|
|
Education |
|
|
Profession |
|
|
Household Size |
|
|
Dwelling Size |
|
|
Years of Residence |
|
|
Demography Group Name |
|
|
Ethnic Background |
|
|
Income Group |
|
|
ORGANIZATION CUSTOMER ATTRIBUTES |
|
|
Organization Type |
|
|
Year of Establishment |
|
|
Total Employee Strength |
|
|
SIC Code |
|
|
Industry Code |
|
|
Pubic Indicator |
|
|
OTHER ATTRIBUTES |
|
|
Customer Occasion Type This Month |
|
|
Campaign This Month |
|
|
Membership Account Type Code |
None if the customer does not have any account; the last used account if the customer has multiple accounts |
|
Life-To-Date Points |
|
|
Available Points |
|
|
Customer Account Type |
None if the customer does not have any account; the last used account if the customer has multiple accounts |
|
Customer Group Code |
None if the customer does not belong to any group |
|
Number of Return items |
|
|
Percentage of Return items |
|
|
Total Revenue |
|
|
Total Orders Placed |
|
|
Total Orders Cancelled |
|
|
Revenue this month |
|
|
Orders this month |
|
|
Channel Type Code |
The DT rules are stored in target table, dwd_cust_lylty_rules.
The SVM factor details of source attributes are stored in target table, dwd_cust_lylty_svm_factor.
Desired Rules Examples:
IF YEARS OF RESIDENCE IS (8 - 10) AND HOUSEHOLD_SIZE IS (3+)
THEN
CUSTOMER IS GROUP A
IF YEARS OF RESIDENCE IS (1 - 3) AND HOUSEHOLD_SIZE IS LESS THAN 3
THEN
CUSTOMER IS GROUP E
Table 10-16 shows sample Customer Loyalty Analysis Attribute Ranking with SVM Factors.
Table 10-17 shows sample Customer Loyalty Analysis Customer Loyalty Prediction (By SVM & DT).
Table 10-17 Customer Loyalty Analysis Customer Loyalty Prediction (By SVM & DT)
| Customer ID | Customer Name | SVM Prediction | SVM Probability | DT Prediction | DT Probability |
|---|---|---|---|---|---|
|
20001 |
Sunil Milenova |
MOST LOYAL |
0.65 |
MOST LOYAL |
0.65 |
|
20002 |
Buzz Krishnan |
PRETTY LOYAL |
0.87 |
PRETTY LOYAL |
0.87 |
|
20003 |
Helena Lamar |
MARGINALLY LOYAL |
0.94 |
MARGINALLY LOYAL |
0.94 |
|
20004 |
Uraih Konur |
PRETTY LOYAL |
0.82 |
PRETTY LOYAL |
0.82 |
|
20005 |
Bonnibelle Goode |
MOST LOYAL |
0.96 |
MOST LOYAL |
0.96 |
The business problem is to build a profile of a store for Shrinkage, Theft, and to predict store KPIs. The KPIs are converted into categorical variables using standard database binning operations for Decision Tree (DT) algorithm. The categorical variables are modeled as a classification model to identify or predict the impact of various independent variables (attributes) on the dependent target variable (KPI - categorical). Using Oracle Data Mining, the binned KPIs are modeled using the classification algorithm Decision Tree (DT) and actual KPIs are modeled using the classification algorithm Support Vector Machines (SVM).
This analysis identifies which key attributes of a store influence Shrinkage and Theft at that store. This model mines the various attributes of store. The model takes the binned variables one at a time for the Total Shrink Count, Total Shrink Amount, Shrink as a percentage, Total Theft Count, Total Theft Amount, Theft as a percentage of Sales as the target variable of a Decision Tree (DT) model with a single feature and discovers rules described in terms of store attributes. The SVM model takes one of six KPIs (Total Shrink Count, Total Shrink Amount, Shrink as a percentage of Sales, Total Theft Count, Total Theft Amount, Theft as a percentage of Sales) at a time as a target variable.
The output from the model is twofold:
The discovered rules provide correlation between the Shrinkage, Theft KPIs and store attributes.
A prediction can be made on new store data using the model built with past data.
Target Variables
The rules are designed to be generated monthly. Therefore the SVM and DT models are created every month across all the employees using the following variables as targets:
Target variables for Decision Tree (DT) are:
Total Shrink Count Quartile (TSCQR)
Total Shrink Count Quintile (TSCQN)
Total Shrink Count Decile (TSCDE)
Total Shrink Amount Quartile (TSAQR)
Total Shrink Amount Quintile (TSAQN)
Total Shrink Amount Decile (TSADE)
Shrink as a percentage of Sales Quartile (STSQR)
Shrink as a percentage of Sales Quintile (STSQN)
Shrink as a percentage of Sales Decile (STSDE)
Total Theft Count Quartile (TTCQR)
Total Theft Count Quintile (TTCQN)
Total Theft Count Decile (TTCDE)
Total Theft Amount Quartile (TTAQR)
Total Theft Amount Quintile (TTAQN)
Total Theft Amount Decile (TTADE)
Theft as a percentage of Sales Quartile (TTSQR)
Theft as a percentage of Sales Quintile (TTSQN)
Theft as a percentage of Sales Decile (TTSDE)
Target variables for Support Vector Machines (SVM) are.
Total Shrink Count (TSC)
Total Shrink Amount (TSA)
Shrink as a percentage of Sales (STS)
Total Theft Count Quartile (TTC)
Total Theft Amount Quintile (TTA)
Theft as a percentage of Sales (TTS)
Table 10-18 shows attributes for stores that are identified from the Oracle Retail Data Model data warehouse tables as source variables for the models (a few of these variables are unique identifiers and are treated as supplementary variables).
Table 10-18 Store Loss Analysis Source Table
| Attribute Name |
|---|
|
Case Id Alt (PK) |
|
Month Code |
|
Store ID |
|
Store Name |
|
Store Manager Name |
|
Store Usage (Store, Store within a store, Department, Kiosk, and others) |
|
Store Status (Under construction, New, and others) |
|
Total Open Hours |
|
Store Location Type (Free standing, Shopping Center, CBD, SBD, NBD, and others) |
|
Primary Trade Area Code |
|
Trade Area Coverage |
|
Market Area Code |
|
Market Area Type (Urban, Suburban, Rural, and others) |
|
Market Area Population |
|
Pull Factor |
|
Total Commuter Population |
|
Peak Season Population |
|
Tourist Population |
|
Average Drive Time |
|
Number of Households |
|
Average Household Size |
|
Average Family Size |
|
Per Capita Income |
|
Average Number of Vehicles per Household |
|
Shopping Center Type (Strip Center, Mall, and others) |
|
Store Concept (Convenience, General Merchandise, Fashion oriented, and others) |
|
Terrain (Mountain, Inland, Desert) |
|
Total Built-up Area |
|
Total Super Built-up Area |
|
Number of Functional Months |
|
Usable Area |
|
Inventory Area |
|
Selling Area |
|
New Store Indicator |
|
Store Price Index |
|
Number of Levels of Floors |
|
Number of Window Displays |
|
Area of Window Displays |
|
Fitting Rooms Available |
|
Number of External Signs |
|
Rest Rooms Available |
|
Type Of Parking |
|
Distance to Nearest Cross |
|
Distance from Market Area Center |
|
Store County or District |
|
Store City |
|
Store State or Province |
|
State Population |
|
State Sales |
|
Store Country |
|
Store World Region |
The DT rules are stored in target table, dwd_store_loss_rules.
The SVM factor details of source attributes are stored in target table, dwd_store_loss_svm_factor.
Desired Rules Examples:
IF STORE IS NEW and NUMBER OF WINDOW DISPLAYS IS (4 - 5)
and STORE DEPARTMENT IS (RETURN)
THEN
STORE THEFT AMOUNT IS THE HIGHEST
IF STORE IS NEW and NUMBER OF WINDOW DISPLAYS IS (4 - 5)
and STORE DEPARTMENT IS (GIFT)
THEN
STORE THEFT AMOUNT IS THE LOWEST
Table 10-19 shows sample Store Loss Analysis Attribute Ranking with SVM Factor.
Table 10-20 shows sample Store Loss Analysis Store KPIs Prediction using DT.
Table 10-20 Store Loss Analysis Store KPIs Prediction using DT Sample 1
| Store ID | Store Name | Target Variable | DT Prediction | DT Probability |
|---|---|---|---|---|
|
601 |
Chloe Waite |
TOTAL_SHRINK_COUNT_DECILE |
7 |
0.65 |
|
602 |
Delora Walker |
TOTAL_SHRINK_COUNT_DECILE |
4 |
0.87 |
|
603 |
Max Gerber |
TOTAL_SHRINK_COUNT_DECILE |
8 |
0.94 |
|
604 |
Glen Christian |
TOTAL_SHRINK_COUNT_DECILE |
3 |
0.82 |
|
605 |
Mason Murray |
TOTAL_SHRINK_COUNT_DECILE |
10 |
0.96 |
Table 10-21 shows sample Store Loss Analysis Store KPIs Prediction using DT.
Table 10-21 Store Loss Analysis Store KPIs Prediction using DT Sample 2
| Store ID | Store Name | Target Variable | DT Prediction | DT Probability |
|---|---|---|---|---|
|
601 |
STORE_601 |
TOTAL_THEFT_AMOUNT_QUINTILE |
5 |
0.65 |
|
602 |
STORE_602 |
TOTAL_THEFT_AMOUNT_QUINTILE |
3 |
0.87 |
|
603 |
STORE_603 |
TOTAL_THEFT_AMOUNT_QUINTILE |
1 |
0.94 |
|
604 |
STORE_604 |
TOTAL_THEFT_AMOUNT_QUINTILE |
3 |
0.82 |
|
605 |
STORE_605 |
TOTAL_THEFT_AMOUNT_QUINTILE |
4 |
0.96 |
Table 10-22 shows sample Store Loss Analysis Store KPIs Prediction Using SVM.
Table 10-22 Store Loss Analysis Store KPIs Prediction Using SVM
| Store ID | Store Name | Target Variable | SVM Prediction |
|---|---|---|---|
|
601 |
STORE_601 |
TOTAL_SHRINK_COUNT |
35 |
|
602 |
STORE_602 |
TOTAL_SHRINK_COUNT |
45 |
|
603 |
STORE_603 |
TOTAL_SHRINK_COUNT |
60 |
|
604 |
STORE_604 |
TOTAL_SHRINK_COUNT |
30 |
|
605 |
STORE_605 |
TOTAL_SHRINK_COUNT |
50 |
Table 10-23 shows sample Store Loss Analysis Store KPIs Prediction Using SVM.
Table 10-23 Store Loss Analysis Store KPIs Prediction Using SVM
| Store ID | Store Name | Target Variable | SVM Prediction |
|---|---|---|---|
|
601 |
STORE_601 |
TOTAL_THEFT_AMOUNT |
1250 |
|
602 |
STORE_602 |
TOTAL_THEFT_AMOUNT |
1100 |
|
603 |
STORE_603 |
TOTAL_THEFT_AMOUNT |
950 |
|
604 |
STORE_604 |
TOTAL_THEFT_AMOUNT |
1150 |
|
605 |
STORE_605 |
TOTAL_THEFT_AMOUNT |
1000 |
The business problem is to build a profile of an item (product) regarding POS losses and predict item KPIs. The KPIs are converted into categorical variables using standard database binning operations for Decision Tree (DT) algorithm. The categorical variables are modeled as a classification model to identify or predict the impact of various independent variables (attributes) on the dependent target variable (KPI - categorical). Using Oracle Data Mining, the binned KPIs are modeled using the classification algorithm Decision Tree (DT) and the actual KPIs are modeled using the classification algorithm Support Vector Machines (SVM).
This analysis identifies which key attributes of an item influence its Shrink and Theft. This model mines the various attributes of items. It takes the binned variables one at a time for the Total Shrink Count, Total Shrink Amount, Shrink as a percentage of Sales, Total Theft Count, Total Theft Amount, Theft as a percentage of Sales as the target variable of a Decision Tree (DT) model with a single feature and discovers rules described in terms of employee attributes. The SVM model takes one of six KPIs (Total Shrink Count, Total Shrink Amount, Shrink as a percentage of Sales, Total Theft Count, Total Theft Amount, Theft as a percentage of Sales) at a time as a target variable.
The output from the model is twofold:
The discovered rules provide correlation between POS loss and item attributes.
The prediction can be made on new item data after the model is trained.
The rules are designed to be generated monthly. Therefore, the SVM and DT models are created every month across all the stores using the following variables as targets:
Target variables for Decision Tree (DT) are:
Total Shrink Count Quartile (TSCQR)
Total Shrink Count Quintile (TSCQN)
Total Shrink Count Decile (TSCDE)
Total Shrink Amount Quartile (TSAQR)
Total Shrink Amount Quintile (TSAQN)
Total Shrink Amount Decile (TSADE)
Shrink as a percentage of Sales Quartile (STSQR)
Shrink as a percentage of Sales Quintile (STSQN)
Shrink as a percentage of Sales Decile (STSDE)
Total Theft Count Quartile (TTCQR)
Total Theft Count Quintile (TTCQN)
Total Theft Count Decile (TTCDE)
Total Theft Amount Quartile (TTAQR)
Total Theft Amount Quintile (TTAQN)
Total Theft Amount Decile (TTADE)
Theft as a percentage of Sales Quartile (TTSQR)
Theft as a percentage of Sales Quintile (TTSQN)
Theft as a percentage of Sales Decile (TTSDE)
Target variables for Support Vector Machines (SVM) are:
Total Shrink Count (TSC)
Total Shrink Amount (TSA)
Shrink as a percentage of Sales (STS)
Total Theft Count Quartile (TTC)
Total Theft Amount Quintile (TTA)
Theft as a percentage of Sales (TTS)
Table 10-24 shows attributes for POS and Item that are identified from the Oracle Retail Data Model data warehouse tables as source variables for the models (a few of these variables are unique identifiers and are treated as supplementary variables).
Table 10-24 Item POS Loss Analysis Source Table
| Attribute Name |
|---|
|
Case Id Alt (PK) |
|
Store Id |
|
Month Code |
|
Item ID |
|
Brand Name |
|
Category Name |
|
Department Name |
|
Customer Pickup Type Code |
|
Discount Indicator |
|
Hazardous Material Type Code |
|
Perishable Indicator |
|
Kit Set Code |
|
Order Collection Code |
|
Price Audit Flag |
|
Sale Weight or Unit Count Code |
|
Security Required Type Code |
|
Sell Unit Landed Cost Amount |
|
Sell Unit Last Received Base Cost Amount |
|
Sell Unit Last Received Net Cost Amount |
|
Item Sale Unit Price Amount |
|
Shrink Flag |
|
Substitute Identified Indicator |
|
Swell Flag |
|
Item Usage Code |
|
Vendor Item Number |
|
Max Shipping Capability |
|
Min Order Quantity |
|
Sale Unit per Packet Unit Count |
|
Shipping Capability Units |
|
Store Order Allowed Flag |
|
Store Receipt Allowed Flag |
|
Style Description |
|
Terms Code |
|
Vendor Number |
|
Vendor Class Code |
|
Buy Status Indicator |
|
Credit Limit Offered |
|
Inform Government Indicator |
|
Vendor Number of Years in Business |
|
Pay Status Indicator |
|
Competitor Retail Item Name |
|
Competitor Name |
|
Competitor Item Local Advertising Flag |
|
Competitor Item On Promotion Flag |
|
Competitor Item Promotion Store Coupon Indicator |
|
Competitor Sale Unit Price Amount |
|
Allow Coupon Multiply Indicator |
|
Allow Food Stamp Indicator |
|
Coupon Restricted Indicator |
|
Electronic Coupon Flag |
|
Employee Discount Allowed Flag |
|
Frequent Shopper Points |
|
Frequent Shopper Points Eligibility Indicator |
|
Give Away Flag |
|
Item Tender Restriction Group Code |
|
Manufacturer |
|
Manufacturer Family Code |
|
Maximum Sale Unit Count |
|
Price Entry Required Flag |
|
Prohibit Repeat Key Flag |
|
Prohibit Return Flag |
|
Selling Status Code |
|
Visual Verify Price Flag |
|
Weight Entry Required Flag |
|
Retail Transaction Measures |
|
Total Number of Retail Transactions For Item |
|
Total Amount of Retail Transactions For Item |
|
Average Amount Per Retail Transaction For Item |
|
Number of Distinct Currency Used For Item |
|
Total Units Sold For Item |
|
Average Units Sold Per Retail Transaction For Item |
|
Total Idle Interval For Item (This is the sum of idle intervals of all transactions that contain this Item) |
|
Average Idle Interval Per Retail Transaction For Item |
|
Total Ring Interval For Item (This is the sum of ring intervals of all transactions that contain this item) |
|
Average Ring Interval Per Retail Transaction For Item |
|
Total Tender Interval For Item (This is the sum of tender intervals of all transactions that contain this item) |
|
Average Tender Interval Per Retail Transaction For Item |
|
Total Lock Interval For Item (This is the sum of lock intervals before or after all transactions that contain this item) |
|
Average Lock Interval Per Retail Transaction For Item |
|
Total Line Items Scanned For Item (This is the total number of times this item is scanned) |
|
Average Line Items Scanned Per Units Sold For Item |
|
Total Line Items Keyed For Item (This is the total number of times this item is keyed) |
|
Average Line Items Keyed Per Units Sold |
|
Total Key Department Count For Item (This is the total number of times this item is keyed by the department) |
|
Average Key Department Count Per Units Sold |
|
Total Service Charge For Item |
|
Average Service Charge Per Retail Transaction For Item |
|
Total Tax Amount For Item |
|
Average Tax Amount Per Retail Transaction For Item |
|
Total Number of Voided Transactions For Item |
|
Average Number of Voided Transactions Per Retail Transaction For Item |
|
Total Amount of Voided Transactions For Item |
|
Average Amount of Voided Transactions Per Retail Transaction For Item |
|
Average Amount of Voided Transaction as Percentage of Total Retail Transaction Amount For Item |
|
Total Number of Discount Line Items For Item |
|
Average Number of Discount Line Items Per Retail Transaction For Item |
|
Total Amount of Discount Line Items For Item |
|
Average Amount of Discount Line Items Per Retail Transaction For Item |
|
Average Amount of Discount Line Items as Percentage of Total Retail Transaction Amount For Item |
|
Total Number of Return Line Items For Item |
|
Average Number of Return Line Items Per Retail Transaction For Item |
|
Total Amount of Return Line Items For Item |
|
Average Amount of Return Line Items Per Retail Transaction For Item |
|
Average Amount of Return Line Items as Percentage of Total Retail Transaction Amount For Item |
|
Total Number of Miscellaneous Fee Line Items For Item |
|
Average Number of Miscellaneous Fee Line Items Per Retail Transaction For Item |
|
Total Amount of Miscellaneous Fee Line Items For Item |
|
Average Amount of Miscellaneous Fee Line Items Per Retail Transaction For Item |
|
Average Amount of Miscellaneous Fee Line Items as Percentage of Total Retail Transaction Amount For Item |
|
Total Number of Promotional Line Items For Item |
|
Average Number of Promotional Line Items Per Retail Transaction For Item |
|
Total Amount of Promotional Line Items For Item |
|
Average Amount of Promotional Line Items Per Retail Transaction For Item |
|
Average Amount of Promotional Line Items as Percentage of Total Retail Transaction Amount For Item |
|
Total Number of Deposit Redemption Line Items For Item |
|
Average Number of Deposit Redemption Line Items Per Retail Transaction For Item |
|
Total Amount of Deposit Redemption Line Items For Item |
|
Average Amount of Deposit Redemption Line Items Per Retail Transaction For Item |
|
Average Amount of Deposit Redemption Line Items as Percentage of Total Retail Transaction Amount For Item |
|
Control Transaction Measures |
|
Total Tax Exempt Transaction Count For Item |
|
Average Tax Exempt Transaction Count Per Retail Transaction For Item |
|
Tax Exempt Total Amount For Item |
|
Average Tax Exempt Amount Per Retail Transaction For Item |
|
Tax Exempt Total Amount as a Percentage of Total Retail Transaction Amount For Item |
|
Total Number of Store Coupons For Item |
|
Average Number of Store Coupons Per Retail Transaction For Item |
|
Average Number of Store Coupons Per Retail Transaction For Item |
|
Total Amount of Store Coupons For Item |
|
Average Amount of Store Coupons Per Retail Transaction For Item |
|
Average Amount of Store Coupons as Percentage of Total Retail Transaction Amount For Item |
|
Total Markdown Count For Item |
|
Average Markdown Count per Retail Transaction For Item |
|
Markdown Total Amount For Item |
|
Average Markdown Amount Per Retail Transaction For Item |
|
Average Markdown Amount as a Percentage of Total Retail Transaction Amount For Item |
|
Total Employee Discount Count For Item |
|
Average Employee Discount Per Retail Transaction For Item |
|
Total Employee Discount Amount For Item |
|
Average Employee Discount Amount Per Retail Transaction For Item |
|
Average Employee Discount Amount as a Percentage of Retail Transaction |
|
Amount For Item |
|
Total Weighed Line Item Count For Item |
|
Average Weighed Line Item Count Per Retail Transaction For Item |
|
Total Weighed Line Item Amount For Item |
|
Average Weighed Line Item Amount Per Retail Transaction For Item |
|
Average Weighed Line Item Amount as a Percentage of Total Retail Transaction |
|
Amount For Item |
|
Total Layaway Payments Collected Count For Item |
|
Average Layaway Payments Collected Count Per Retail Transaction For Item |
|
Total Layaway Payments Collected Amount For Item |
|
Average Layaway Payments Collected Amount Per Retail Transaction For Item |
|
Average Layaway Payments Collected Amount as a Percentage of Total Retail |
|
Transaction Amount For Item |
|
Total Container Deposit Count For Item |
|
Average Container Deposit Count Per Retail Transaction For Item |
|
Total Container Deposit Amount For Item |
|
Average Container Deposit Amount Per Retail Transaction For Item |
|
Average Container Deposit Amount as a Percentage of Total Retail Transaction |
|
Amount For Item |
|
Total Redeemed Container Deposit Count For Item |
|
Average Redeemed Container Deposit Count Per Retail Transaction For Item |
|
Total Redeemed Container Deposit Amount For Item |
|
Average Redeemed Container Deposit Amount Per Retail Transaction For Item |
|
Average Redeemed Container Deposit Amount as a Percentage of Total Retail |
|
Transaction Amount For Item |
|
Total Cash Tender Count For Item |
|
Average Cash Tender Count Per Retail Transaction For Item |
|
Total Cash Tender Amount For Item |
|
Average Cash Tender Amount Per Retail Transaction For Item |
|
Average Cash Tender Amount as a Percentage of Total Retail Transaction Amount |
|
For Item |
|
Total Check Tender Count For Item |
|
Average Check Tender Count Per Retail Transaction For Item |
|
Total Check Tender Amount For Item |
|
Average Check Tender Amount Per Retail Transaction For Item |
|
Average Check Tender Amount as a Percentage of Total Retail Transaction |
|
Amount For Item |
|
Total Credit Card Tender Count For Item |
|
Average Credit Card Tender Count Per Retail Transaction For Item |
|
Total Credit Card Tender Amount For Item |
|
Average Credit Card Tender Amount Per Retail Transaction For Item |
|
Average Credit Card Tender Amount as a Percentage of Total Retail Transaction |
|
Amount For Item |
|
Total Debit Card Tender Count For Item |
|
Average Debit Card Tender Count Per Retail Transaction For Item |
|
Total Debit Card Tender Amount For Item |
|
Average Debit Card Tender Amount Per Retail Transaction For Item |
|
Average Debit Card Tender Amount as a Percentage of Total Retail Transaction |
|
Amount For Item |
|
Total Customer Account Tender Count For Item |
|
Average Customer Account Tender Count Per Retail Transaction For Item |
|
Total Customer Account Tender Amount For Item |
|
Average Customer Account Tender Amount Per Retail Transaction |
|
Average Customer Account Tender Amount as a Percentage of Total Retail |
|
Transaction Amount |
|
Total Gift Certificate Tender Count For Item |
|
Average Gift Certificate Tender Count Per Retail Transaction For Item |
|
Total Gift Certificate Tender Amount For Item |
|
Average Gift Certificate Tender Amount Per Retail Transaction For Item |
|
Amount For Item |
|
Total Coupon Tender Count For Item |
|
Average Coupon Tender Count Per Retail Transaction For Item |
|
Total Coupon Tender Amount For Item |
|
Average Coupon Tender Amount Per Retail Transaction For Item |
|
Average Coupon Tender Amount as a Percentage of Total Retail Transaction |
|
Amount For Item |
The DT rules are stored in target table, dwd_item_pos_loss_rules.
The SVM factor details of source attributes are stored in target table, dwd_item_pos_loss_svm_factor.
Desired Rules Examples:
IF EMP_DISCOUNT_ALLOWED_IND IS 'Y' and SCANNED_PER_UNITS_SOLD IS (0.8-1)
THEN
THEFT_AMOUNT_TO_SALES_AMOUNT_QUARTILE IS THE HIGHEST
IF SCANNED_PER_UNITS_SOLD IS (0.8-1) and DEPARTMENT_NAME IN ('BEVERAGE', 'CIGARETTES')
THEN
SHRINK_AMOUNT_TO_SALES_AMOUNT_QUARTILE IS THE HIGHEST
Table 10-25 shows sample Item POS Loss Analysis Attribute Ranking with SVM Factor.
Table 10-26 shows sample Item POS Loss Analysis Item KPIs Prediction using DT.
Table 10-26 Item POS Loss Analysis Item KPIs Prediction using DT Sample 1
| Item ID | Item Name | Target Variable | DT Prediction | DT Probability |
|---|---|---|---|---|
|
2000001 |
Item_2000001 |
TOTAL_SHRINK_COUNT_DECILE |
7 |
0.65 |
|
2000002 |
Item_2000002 |
TOTAL_SHRINK_COUNT_DECILE |
4 |
0.87 |
|
2000003 |
Item_2000003 |
TOTAL_SHRINK_COUNT_DECILE |
8 |
0.94 |
|
2000004 |
Item_2000004 |
TOTAL_SHRINK_COUNT_DECILE |
3 |
0.82 |
|
2000005 |
Item_2000005 |
TOTAL_SHRINK_COUNT_DECILE |
10 |
0.96 |
Table 10-27 shows sample Item POS Loss Analysis Item KPIs Prediction using DT.
Table 10-27 Item POS Loss Analysis Item KPIs Prediction using DT Sample 2
| Item ID | Item Name | Target Variable | DT Prediction | DT Probability |
|---|---|---|---|---|
|
2000001 |
Item_2000001 |
TOTAL_THEFT_AMOUNT_QUINTILE |
5 |
0.65 |
|
2000002 |
Item_2000002 |
TOTAL_THEFT_AMOUNT_QUINTILE |
3 |
0.87 |
|
2000003 |
Item_2000003 |
TOTAL_THEFT_AMOUNT_QUINTILE |
1 |
0.94 |
|
2000004 |
Item_2000004 |
TOTAL_THEFT_AMOUNT_QUINTILE |
3 |
0.82 |
|
2000005 |
Item_2000005 |
TOTAL_THEFT_AMOUNT_QUINTILE |
4 |
0.96 |
Table 10-28 shows sample Item POS Loss Analysis Item KPIs Prediction using SVM.
Table 10-28 Item POS Loss Analysis Item KPIs Prediction using SVM Sample 1
| Item ID | Item Name | Target Variable | SVM Prediction | SVM Probability |
|---|---|---|---|---|
|
2000001 |
Item_2000001 |
TOTAL_SHRINK_COUNT |
35 |
0.65 |
|
2000002 |
Item_2000002 |
TOTAL_SHRINK_COUNT |
45 |
0.87 |
|
2000003 |
Item_2000003 |
TOTAL_SHRINK_COUNT |
60 |
0.94 |
|
2000004 |
Item_2000004 |
TOTAL_SHRINK_COUNT |
30 |
0.82 |
|
2000005 |
Item_2000005 |
TOTAL_SHRINK_COUNT |
50 |
0.96 |
Table 10-29 shows sample Item POS Loss Analysis Item KPIs Prediction using SVM.
Table 10-29 Item POS Loss Analysis Item KPIs Prediction using SVM Sample 2
| Item ID | Item Name | Target Variable | SVM Prediction | SVM Probability |
|---|---|---|---|---|
|
2000001 |
Item_2000001 |
TOTAL_THEFT_AMOUNT |
1250 |
0.65 |
|
2000002 |
Item_2000002 |
TOTAL_THEFT_AMOUNT |
1100 |
0.87 |
|
2000003 |
Item_2000003 |
TOTAL_THEFT_AMOUNT |
950 |
0.94 |
|
2000004 |
Item_2000004 |
TOTAL_THEFT_AMOUNT |
1150 |
0.82 |
|
2000005 |
Item_2000005 |
TOTAL_THEFT_AMOUNT |
1000 |
0.96 |
This model addresses the business problem of discovering product categories that are frequently bought together by customers. The model is used to understand the Categories purchased by a Customer in a typical transaction in terms of the components like the Categories in the Basket, Target Category in a Basket and additional information like Basket Significance (Sales Value), Target Category Significance (Sales Value) which are generated from regular Customer Transactional data.
Using Oracle Data Mining, the KPIs are modeled with the APRIORI algorithm utilized by the Association Rules model. The model type used for Association Rules with Apriori Algorithm is APASS. This is an example of Unclassified Learning since the Categories (or Target Category) which make up the Category Basket are not inferred or guided (as part of data preparation) but are generated by the model itself.
The output from the model is, the purchase patterns are designed to be generated monthly. Therefore, the APASS models are created every month.
Table 10-30 shows the item attributes that are identified as source variables for this Association Rules model.
Table 10-30 Product Category Mix Analysis Source Table
| Attribute Name |
|---|
|
Case Id Alt (PK) |
|
Store ID |
|
Month Code |
|
ID |
|
Name |
|
Value |
Note: If mining has to performed at multiple levels, such as category, subcategory, item, there may be multiple source tables.
The mined patterns/rules are stored in target table, dwd_prod_deptmix_assoc_rules.
Desired Rules Example1
IF CUSTOMER HAS BOUGHT 'BABY', 'GRAB AND GO'
THEN
CUSTOMER IS LIKELY TO BUY ' PACKAGED BEVERAGES' ( Support: 36%, Probability: 56%)
Category Basket Significance of ('BABY', 'GRAB AND GO', 'PACKAGED BEVERAGES') is 45% of Sales Value => The Sales from the 3 categories in Category Basket ('BABY', 'GRAB AND GO', 'PACKAGED BEVERAGES') account for 45% of the Total Sales across all categories in that particular store.
The Category Basket Significance (Sales Value) KPI allows us to filter out Rules which may be insignificant from a Basket Sales Value perspective.
Target Category Significance of ('PACKAGED BEVERAGES') is 60% of the Basket Sales Value => The Sales from the Target Category ('PACKAGED BEVERAGES') account for 60% of the Total Sales from the Category Basket ('BABY', 'GRAB AND GO', 'PACKAGED BEVERAGES') in that particular store.
The Target Category Significance (Sales Value) KPI allows us to filter out Rules determining insignificant Customer Purchases (insignificant Target Category). In other words, it helps us to extract Rules which relate to significant Customer Purchases, where the Target Category is significant within the Basket of Categories (from a Sales Value perspective). This could be useful from a campaign/promotion/upsell perspective.
Desired Rules Example2
IF
CUSTOMER HAS BOUGHT 'FLORAL', 'PHARMACY', 'HOT FOODS'
THEN
CUSTOMER IS LIKELY TO BUY 'BABY' (Support: 36%, Probability: 62%)
This model addresses the business problem of predicting price elasticity of a product or a group of products. Here, product is SKU item and a group of products can be either sub-class, class, and so on. Predicting price elasticity of a product can help calculate sales of a product across different stores.
A model is built for each product using promotion sales data till date across all stores as training data. The built model of each product is used to predict what would be the price elasticity of each product. Sales of a product in coming time period are calculated using price elasticity of the product, which will eventually help retailer to take a decision on promotion of the product.
Using Oracle Data Mining, the target variable (KPI) is modeled using Regression algorithm - Support Vector Machines (SVM).
The output from the model is, the price elasticity of each product to be predicted every month. Therefore, the SVM Regression models are created one time each month.
Table 10-31 shows the sample Product Price Elasticity Analysis Source Table.
Table 10-31 Product Price Elasticity Analysis Source Table
| Attribute Name | Attribute Description |
|---|---|
|
case_id (PK) |
|
|
mo_cd |
|
|
bsns_unit_key |
Store Key |
|
bsns_unit_typ_cd |
Store Type Code |
|
sku_item_key |
|
|
sku_item_nbr |
|
|
sku_item_name |
|
|
sku_item_desc |
|
|
item_class_key |
|
|
class_cd |
|
|
class_name |
|
|
wk_key |
|
|
wk_cd |
|
|
rtl_typ_cd |
|
|
chnl_typ_cd |
|
|
phs_key |
|
|
prmtn_key |
|
|
cmpgn_media_key |
|
|
media_slng_item_key |
|
|
pos_dept_key |
|
|
sls_unit_cnt_last_wk |
|
|
sls_trx_cnt_last_wk |
|
|
sls_amt_last_wk |
|
|
sls_unit_price_last_wk |
|
|
sls_unit_cnt_curr_wk |
|
|
sls_trx_cnt_curr_wk |
|
|
sls_amt_curr_wk |
|
|
sls_unit_price_curr_wk |
|
|
prcntg_chg_in_sls_amt |
|
|
price_mrkdwn_rate |
|
|
sku_item_price_elstcty_dmnd (Target variable) |
Price elasticity of demand |
The SVM factor details of source attributes are stored in target tables, dwd_sku_prc_elsty_svm_factor and dwd_class_prc_elsty_svm_factor.
Table 10-32 shows sample Product Price Elasticity Analysis Attribute Ranking with SVM Factor.
The business problem is to identify combination of employees, which is likely to perform better at a store on a shift. The training data would include following attributes of combination, employee average, minimum, and maximum age, employee average, minimum, and maximum distance from store, employee average, minimum, and maximum total baskets, and so on. Those combination attributes are extracted from employee attributes. The performance of each combination, which is target attribute of classification model, is measured by total store sales amount for the shift combination of employees work.
The performance metric, total store sales amount, is converted into categorical variable using standard binning operations. The categorical variable is modeled as a classification model to identify the impact of combination attributes on the target variable. Using Oracle Data Mining, the categorical target attribute is modeled using one or both classification algorithms - Decision Tree (DT) and Support Vector Machines (SVM).
The retailer has to generate different combinations of employees, based on the availability of employees for a shift and also need to extract same attributes (used in training data) for each combination. The trained model is used to predict the categorical performance attribute value for all the combinations of employees generated. The combination which is predicted to perform better can be assigned to targeted store on a shift.
This classification analysis identifies which attributes of a combination influence the overall performance of a store on a shift. The output of this analysis is twofold:
The rules discovered by DT model provide correlation between store performance and employees combination attributes.
For future employee allocation, the trained model is applied on different combinations to predict what would be the performance of store.
The rules are designed to be generated monthly. Therefore, one SVM and one DT models are created every month across all the employees at each store using the following variable as target:
Target variable for Decision Tree (DT) and Support Vector Machines (SVM) is: PERFORMANCE INDICATOR
The values for target variable could be: VERY_HIGH, HIGH, MEDIUM, LOW, VERY_LOW
Table 10-33 shows the attributes that are extracted for each combination from employees attributes. (a few of these variables are unique identifiers and are treated as supplementary variables).
Table 10-33 Employee Combination Analysis Source Table
| Attribute Name | Attribute Description |
|---|---|
|
Case id |
need unique identified for mining analysis |
|
Store key |
|
|
Store name |
|
|
Shift mode |
|
|
Month mode |
|
|
Derived Attributes |
|
|
Emp count |
|
|
Emp avg age |
|
|
Emp min age |
|
|
Emp max age |
|
|
Avg household size |
|
|
Min household size |
|
|
Max household size |
|
|
No. of emp with 10th education |
|
|
No. of emp with 12th education |
|
|
No. of emp with UG education |
|
|
Emp house avg distance from store |
|
|
Emp house min distance from store |
|
|
Emp house max distance from store |
|
|
Married count |
|
|
Single count |
|
|
Divorced count |
|
|
Male emp count |
|
|
Female emp count |
|
|
Emp avg income |
|
|
Emp min income |
|
|
Emp max income |
|
|
No. of emp with disability |
|
|
No. of emp eligible for HR based salary |
|
|
No. of emp eligible for overtime hours salary |
|
|
No. of emp eligible for commission |
|
|
No. of emp eligible for SPIFF |
|
|
Emp avg total hours worked |
|
|
Emp min total hours worked |
|
|
Emp max total hours worked |
|
|
Emp avg total overtime hours worked |
|
|
Emp min total overtime hours worked |
|
|
Emp max total overtime hours worked |
|
|
Emp avg total sales amount |
|
|
Emp min total sales amount |
|
|
Emp max total sales amount |
|
|
Emp avg basket size |
|
|
Emp min basket size |
|
|
Emp max basket size |
|
|
Emp avg basket value |
|
|
Emp min basket value |
|
|
Emp max basket value |
The DT rules are stored in target table, dwd_emp_cmbntn_dt_rules.
The SVM factor details of source attributes are stored in target table, dwd_emp_cmbntn_mnng.
Desired Rules Example 1
IF emp avg age is 25 AND min household size is 2
THEN
PERFORMANCE INDICATOR IS HIGH
Desired Rules Example 2
IF number of emp eligible for HR based salaryis 10 AND married count is 8
THEN
PERFORMANCE INDICATOR IS LOW
Table 10-34 shows sample Employee Combination Analysis Attribute Ranking with SVM Factor.
Table 10-34 Employee Combination Analysis Attribute Ranking with SVM Factor
| Attribute Name | Attribute Value | Coefficient | Rank |
|---|---|---|---|
|
Emp min age |
21 |
1 |
1 |
|
Male emp count |
10 |
0.87 |
2 |
|
No. of emp eligible for HR based salary |
3 |
0.39 |
3 |
|
Emp avg total sales amount |
$25000 |
0.39 |
4 |
|
Emp avg income |
$3200 |
0.22 |
5 |
|
No. of emp with 12th education |
15 |
0.17 |
6 |
Table 10-35 shows sample Employee Combination Analysis Employee Combination Performance Prediction (By DT & SVM).
Table 10-35 Employee Combination Analysis Employee Combination Performance Prediction (By DT & SVM)
| Combination ID | SVM Prediction | SVM Probability | DT Prediction | DT Probability |
|---|---|---|---|---|
|
10001 |
HIGH |
0.65 |
HIGH |
0.56 |
|
10002 |
VERY HIGH |
0.87 |
VERY HIGH |
0.78 |
|
10003 |
LOW |
0.94 |
LOW |
0.94 |
|
10004 |
MEDIUM |
0.82 |
MEDIUM |
0.82 |
|
10005 |
HIGH |
0.96 |
HIGH |
0.69 |
The business problem is to group customers into generally homogeneous groups based on customer demographics, usage pattern and products they purchased (customer purchase history). Business Analysts can look into each segments to further understand the customer group discovered by the model and name each segment.
The customers are clustered using Clustering algorithms - O-cluster and K-Means. The discovered clustering rules draw the profile of customers.
Table 10-36 shows the attributes for customers that are identified from the Oracle Retail Data Model data warehouse tables as source variables for the models (a few of these variables are unique identifiers and are treated as supplementary variables).
Table 10-36 Customer Segmentation Analysis Source Table
| Attribute Name | Attribute Description |
|---|---|
|
Customer Key (PK) |
|
|
Month Code |
|
|
Customer Number |
|
|
Customer Type |
|
|
Frequent Shopper Indicator |
|
|
Mail Allowed Indicator |
|
|
Customer District |
|
|
Customer City |
|
|
Customer State |
|
|
Customer Country |
|
|
Primary Occasion |
|
|
Primary Preference |
|
|
Primary Status Code |
|
|
Primary Status Reason Code |
|
|
Primary Effective From Date |
|
|
No. Of Survival months |
|
|
Primary Effective To Date |
|
|
Living at Current Address Since |
|
|
INDIVIDUAL CUSTOMER ATTRIBUTES |
|
|
Registered as Gift Receiver |
|
|
Registered as Gift Giver |
|
|
Customer Identity Required Indicator |
|
|
Customer Identity Type Name |
|
|
Age |
|
|
Marital Status |
|
|
Gender |
|
|
Income |
|
|
Race |
|
|
Education |
|
|
Occupation |
|
|
Household Size |
|
|
Dwelling Size |
|
|
Years of Residence |
|
|
Demography Group Name |
|
|
Ethnic Background |
|
|
Income Group |
|
|
ORGANIZATION CUSTOMER ATTRIBUTES |
|
|
Organization Type |
|
|
Year of Establishment |
|
|
Total Employee Strength |
|
|
SIC Code |
|
|
Industry Code |
|
|
Pubic Indicator |
|
|
OTHER ATTRIBUTES |
|
|
Customer Occasion Type This Month |
|
|
Customer Preference Value This Month |
|
|
Campaign This Month |
|
|
Membership Account Type Code |
None if the customer does not have any account; the last used account if the customer has multiple accounts |
|
Life-To-Date Points |
|
|
Available Points |
|
|
Customer Account Type |
None if the customer does not have any account; the last used account if the customer has multiple accounts |
|
Customer Group Code |
None if the customer does not belong to any group |
|
Number of Return items |
|
|
Percentage of Return items |
|
|
Total Revenue |
|
|
Total Orders Placed |
|
|
Total Orders Cancelled |
|
|
Revenue this month |
|
|
Orders this month |
|
|
Channel Type Code |
The clustering rules are stored in target table, dwr_cust_sgmnt.
Desired Rules Example 1
IF YEARS OF RESIDENCE IS (8 - 10) and HOUSEHOLD_SIZEIS (3+) and MARITAL_STATUS IS SINGLE
and EDUCATION 12th and INCOME LEVEL IS BETWEEN 1000 AND 2000
THEN
SEGMENT_ID IS 3
Desired Rules Example 2
IF YEARS OF RESIDENCE IS (1 - 3) and HOUSEHOLD_SIZEIS (3+) and MARITAL_STATUS IS SINGLE
and EDUCATION PHD and INCOME LEVEL IS (5000 - 10000)
THEN
SEGMENT_ID IS 8
The business problem is to identify/predict the customers who are likely to represent the highest value of revenue over their life time based on criteria such as customer demographic information, purchase behavior, and service quality, and so on.
This analysis identifies which key attributes of a customer influence his or her Life TimeValue. Life Time Value is continuous value (total revenue contributed by the customer). The Life Time Value is converted into categorical values using standard binning operations. The categorical variables are modeled as a classification model to identify or predict the impact of various independent variables (attributes) on the dependent target variable (KPI - categorical). Using Oracle Data Mining, the target variable, Categorical Life Time Value, is modeled using classification algorithm, Decision Tree (DT).
The continuous Life Time Value is modeled as a regression model using regression algorithm, Support Vector Machines (SVM).
The mining models are built every month using the customer latest data and the mining models are applied on customers data to predict which customer is likely to represent the highest value of revenue over their life time.
The output from the model is two-fold:
The discovered rules to outline the profile of customers who are most likely to represent the highest value of revenue over their life time.
A prediction can be made on customer data after the model is trained.
The rules are designed to be generated monthly. Therefore, two SVM and two DT models are created every month across all the customers using the following variables as targets:
Target variables for Decision Tree (DT) is:
Life Time Value Code
Life Time Survival Value Code
Target variables for Support Vector Machines (SVM) are:
Life Time Value
Life Time Survival Value
Table 10-37 shows the attributes for customers that are identified from the Oracle Retail Data Model data warehouse tables as source variables for the models (a few of these variables are unique identifiers and are treated as supplementary variables).
Table 10-37 Customer Life Time Value Analysis Source Table
| Attribute Name | Attribute Description |
|---|---|
|
Case Id Alt (PK) |
|
|
Month Code |
|
|
Customer Number |
|
|
Customer Type |
|
|
Frequent Shopper Indicator |
|
|
Mail Allowed Indicator |
|
|
Customer District |
|
|
Customer City |
|
|
Customer State |
|
|
Customer Country |
|
|
Primary Occasion |
|
|
Primary Preference |
|
|
Primary Status Code |
|
|
Primary Status Reason Code |
|
|
Primary Effective Date |
|
|
No. Of Survival months |
|
|
Primary Effective Date |
|
|
Living at Current Address Since |
|
|
INDIVIDUAL CUSTOMER ATTRIBUTES |
|
|
Registered as Gift Receiver |
|
|
Registered as Gift Giver |
|
|
Customer Identity Required Indicator |
|
|
Customer Identity Type Name |
|
|
Age |
|
|
Marital Status |
|
|
Gender |
|
|
Income |
|
|
Race |
|
|
Education |
|
|
Profession |
|
|
Household Size |
|
|
Dwelling Size |
|
|
Years of Residence |
|
|
Demography Group Name |
|
|
Ethnic Background |
|
|
Income Group |
|
|
ORGANIZATION CUSTOMER ATTRIBUTES |
|
|
Organization Type |
|
|
Year of Establishment |
|
|
Total Employee Strength |
|
|
SIC Code |
|
|
Industry Code |
|
|
Pubic Indicator |
|
|
OTHER ATTRIBUTES |
|
|
Customer Occasion Type This Month |
|
|
Campaign This Month |
|
|
Membership Account Type Code |
None if the customer does not have any account; the last used account if the customer has multiple accounts |
|
Life-To-Date Points |
|
|
Available Points |
|
|
Customer Account Type |
None if the customer does not have any account; the last used account if the customer has multiple accounts |
|
Customer Group Code |
None if the customer does not belong to any group |
|
Number of Return items |
|
|
Percentage of Return items |
|
|
Total Revenue |
|
|
Total Orders Placed |
|
|
Total Orders Cancelled |
|
|
Revenue this month |
|
|
Orders this month |
|
|
Channel Type Code |
The DT rules are stored in target table, dwd_cust_ltv_dt_rules.
The SVM factor details of source attributes are stored in target table, dwd_cust_ltv_svm_factor.
Desired Rules Example 1
IF YEARS OF RESIDENCE IS (8 - 10) ANDHOUSEHOLD_SIZE IS (3+)
THEN
CUST_LTV IS HIGH
Desired Rules Example 2
IF YEARS OF RESIDENCE IS (1 - 3) AND HOUSEHOLD_SIZE IS (LESS THAN 3)
THEN
CUST_LTV IS VERY_LOW
Table 10-38 shows sample Customer Life Time Value Analysis Attribute Ranking with SVM Factor.
Table 10-38 Customer Life Time Value Analysis Attribute Ranking with SVM Factor
| Attribute Name | Attribute Value | Coefficient | Rank |
|---|---|---|---|
|
YEARS_OF_RESIDENCE |
10 |
1.51 |
1 |
|
HOUSEHOLD_SIZE |
3 |
1.32 |
2 |
|
MARITAL_STATUS |
SINGLE |
1.2 |
3 |
|
MARITAL_STATUS |
MARRIED |
0.98 |
4 |
|
EDUCATION |
12th |
0.84 |
5 |
|
EDUCATION |
PhD |
0.78 |
6 |
|
EDUCATION |
Masters |
0.66 |
7 |
|
MARITAL_STATUS |
DIVORCED |
0.25 |
8 |
|
INCOME_LEVEL |
1500 |
0.24 |
9 |
|
INCOME_LEVEL |
10000 |
0.22 |
10 |
|
RACE |
White |
0.16 |
11 |
|
CUST_OCCASIONTYPE_THIS_MONTH |
ANNIVERSARY |
0.15 |
12 |
Table 10-39 shows sample Customer LTV Code Prediction (Using DT) - Classification.
Table 10-40 shows sample Customer LTV Prediction (Using SVM)- Regression.
Table 10-41 shows sample Customer LT Survival Value Code Prediction (Using) - Classification.
Table 10-42 shows sample Customer LT Survival Value Prediction (Using SVM) Regression.
The business problem is to identify/predict the customers who are likely to leave the current retailer for a competitor based on criteria such as customer demographic information, purchase behavior, and service quality, and so on.
This analysis identifies which key attributes of a customer influence his or her churn indicator value. Using Oracle Data Mining, the target variable, churn indicator, is modeled using classification algorithms - Decision Tree (DT) and Support Vector Machines (SVM).
The mining models (DT & SVM) are built every month using the historical customer data and the mining models are applied on current base customers data to predict which customer is likely to leave (churn) the current retailer.
The output from the model is two fold:
The discovered rules to outline the profile of customers who are most likely to churn. What type of customer is more likely to churn.
The prediction can be made on customer data after the Churn model is trained.
Table 10-43 shows the attributes for customers that are identified from the Oracle Retail Data Model data warehouse tables as source variables for the models (a few of these variables are unique identifiers and are treated as supplementary variables).
Table 10-43 Customer Churn Analysis Source Table
| Attribute Name | Attribute Description |
|---|---|
|
Case Id Alt (PK) |
|
|
Month Code |
|
|
Customer Number |
|
|
Customer Type |
|
|
Frequent Shopper Indicator |
|
|
Mail Allowed Indicator |
|
|
Customer District |
|
|
Customer City |
|
|
Customer State |
|
|
Customer Country |
|
|
Primary Occasion |
|
|
Primary Preference |
|
|
Primary Status Code |
|
|
Primary Status Reason Code |
|
|
Primary Effective Date |
|
|
No. Of Survival months |
|
|
Primary Effective Date |
|
|
Living at Current Address Since |
|
|
INDIVIDUAL CUSTOMER ATTRIBUTES |
|
|
Registered as Gift Receiver |
|
|
Registered as Gift Giver |
|
|
Customer Identity Required Indicator |
|
|
Customer Identity Type Name |
|
|
Age |
|
|
Marital Status |
|
|
Gender |
|
|
Income |
|
|
Race |
|
|
Education |
|
|
Profession |
|
|
Household Size |
|
|
Dwelling Size |
|
|
Years of Residence |
|
|
Demography Group Name |
|
|
Ethnic Background |
|
|
Income Group |
|
|
ORGANIZATION CUSTOMER ATTRIBUTES |
|
|
Organization Type |
|
|
Year of Establishment |
|
|
Total Employee Strength |
|
|
SIC Code |
|
|
Industry Code |
|
|
Pubic Indicator |
|
|
OTHER ATTRIBUTES |
|
|
Customer Occasion Type This Month |
|
|
Campaign This Month |
|
|
Membership Account Type Code |
None if the customer does not have any account; the last used account if the customer has multiple accounts |
|
Life-To-Date Points |
|
|
Available Points |
|
|
Customer Account Type |
None if the customer does not have any account; the last used account if the customer has multiple accounts |
|
Customer Group Code |
None if the customer does not belong to any group |
|
Number of Return items |
|
|
Percentage of Return items |
|
|
Total Revenue |
|
|
Total Orders Placed |
|
|
Total Orders Cancelled |
|
|
Revenue this month |
|
|
Orders this month |
|
|
Channel Type Code |
The DT rules are stored in target table, dwd_cust_chrn_dt_rules.
The SVM factor details of source attributes are stored in target table, dwd_cust_chrn_svm_factor.
Desired Rules Example 1
IF YEARS OF RESIDENCEIS (8 - 10) AND HOUSEHOLD_SIZE IS (3+)
THEN
CHURN_IND IS 1
Desired Rules Example 2
IF YEARS OF RESIDENCE IS (1 - 3) AND HOUSEHOLD_SIZE IS (LESS THAN 3)
THEN
CHURN_IND IS 0
Table 10-44 shows sample Customer Churn Analysis Attribute Ranking with SVM Factor.
Table 10-44 Customer Churn Analysis Attribute Ranking with SVM Factor
| Attribute Name | Attribute Value | Coefficient | Rank |
|---|---|---|---|
|
YEARS_OF_RESIDENCE |
10 |
1.51 |
1 |
|
HOUSEHOLD_SIZE |
3 |
1.32 |
2 |
|
MARITAL_STATUS |
SINGLE |
1.2 |
3 |
|
MARITAL_STATUS |
MARRIED |
0.98 |
4 |
|
EDUCATION |
12th |
0.84 |
5 |
|
EDUCATION |
PhD |
0.78 |
6 |
|
EDUCATION |
Masters |
0.66 |
7 |
|
MARITAL_STATUS |
DIVORCED |
0.25 |
8 |
|
INCOME_LEVEL |
1500 |
0.24 |
9 |
|
INCOME_LEVEL |
10000 |
0.22 |
10 |
|
RACE |
White |
0.16 |
11 |
|
CUST_OCCASIONTYPE_THIS_MONTH |
ANNIVERSARY |
0.15 |
12 |
Table 10-45 shows sample Customer Churn Prediction (By DT & SVM).
Table 10-45 Customer Churn Prediction (By DT & SVM)
| Customer ID | Customer Name | SVM Prediction | SVM Probability | DT Prediction | DT Probability |
|---|---|---|---|---|---|
|
20001 |
Sunil Milenova |
1 |
0.65 |
0 |
0.56 |
|
20002 |
Buzz Krishnan |
0 |
0.87 |
0 |
0.78 |
|
20003 |
Helena Lamar |
0 |
0.94 |
0 |
0.94 |
|
20004 |
Uraih Konur |
0 |
0.82 |
0 |
0.82 |
|
20005 |
Bonnibelle Goode |
1 |
0.96 |
1 |
0.69 |
The business problem is to measure customer sentiment regarding the products and service quality according to any text message received from the customer. Those text messages may be emails from a customer, or written by call center agents during call center calls, and so on. Some companies use voice recognition technology and others have call center service agents write what the customer said.
This model leverages Text mining capability provided by Oracle database. The text messages are transformed using Oracle text. A classification model is built over the training data using the classification algorithm, Support Vector Machines (SVM). The built model is applied on new customers text messages and also on existing customers new text messages to predict the sentiment.
The sentiment mining model is trained once a month. Therefore one SVM model is created every month across all the customers with the following variable as target:
Customer Sentiment
|
Copyright © 2009, 2012, Oracle and/or its affiliates. All rights reserved. Legal Notices |
|